Using past data to predict whether 2020 will be the warmest on record
Ars Technica » Scientific Method 2020-06-19
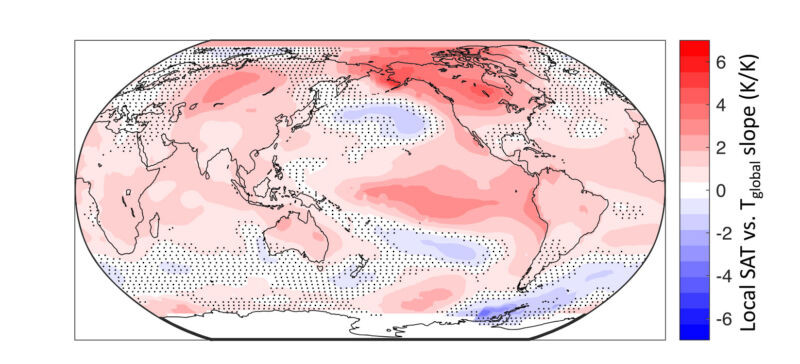
Enlarge / One interesting way to look at the world: the darker the red, the closer the correlation between local temperature and global mean. Blue areas tend to prefer contrarian temperatures. (credit: Brown and Caldeira/Earth and Space Science)
Meteorologists run weather-forecast models to provide good predictions of weather conditions over the next few days. Climate scientists, on the other hand, run global climate models to project the impacts of climate-changing greenhouse gas emissions over the next few decades. In between these two activities is an interesting task that has proven more difficult than either: predicting global temperature over a few years.
A new study by Patrick Brown and Ken Caldeira tries a new approach to this challenge using nothing more than statistical analysis of the previous two years’ temperatures.
The annual average surface temperature for the globe varies a bit from one year to the next even as a long-term warming trend is apparent. It’s those year-to-year wiggles that are hard to predict. They depend on variable regional weather patterns, most notably the El Niño Southern Oscillation. This seesaw pattern of warm surface water along the equatorial Pacific is significant enough to bump the planet’s average surface temperature up and down. It also affects weather patterns in many places around the world.
Read 11 remaining paragraphs | Comments