NAEP puzzles
Language Log 2025-01-31
The 2024 results from the National Assessment of Educational Practices (NAEP) have recently been in the news, mostly not on the positive side, e.g. "American Children’s Reading Skills Reach New Lows", NYT 1/29/2024. The IES has an excellent NAEP website, with lots of information about what the tests are, how the tests are developed, administered, and scored, and what the results have been over time and space. Among many other things, there's a "questions library", which lets you explore the questions actually used in the test, a sample of graded student responses, and so on.
Looking through this material leaves me impressed with the process and its on-line documentation — but still puzzled about two things, both of which have to do with the meaning of NAEP comparisons across time.
First, how are the results normalized for comparing across time, given that the questions are different every year that the test is given? And (as this page from An Introduction to NAEP explains), the overall "framework" for designing and scoring the questions also changes:
Each NAEP assessment is built from a content framework that specifies what students show know and be able to do in a given grade. […]
The frameworks reflect ideas and input from subject area experts, school administrators, policymakers, teachers, parents, and others. NAEP frameworks also describe the types of questions that should be included and how they should be designed and scored.
This page tells us how to interpret comparisons across "states, districts, and student groups":
Student performance on NAEP assessments is presented in two ways:
- Average scale scores represent how students performed on each assessment. Scores are aggregated and reported at the student group level for the nation, states, and districts. They can also be used for comparisons among states, districts, and student groups.
- NAEP achievement levels are performance standards that describe what students should know and be able to do. Results are reported as percentages of students performing at or above three achievement levels (NAEP Basic, NAEP Proficient, and NAEP Advanced). Students performing at or above the NAEP Proficient level on NAEP assessments demonstrate solid academic performance and competency over challenging subject matter. It should be noted that the NAEP Proficient achievement level does not represent grade level proficiency as determined by other assessment standards (e.g., state or district assessments).
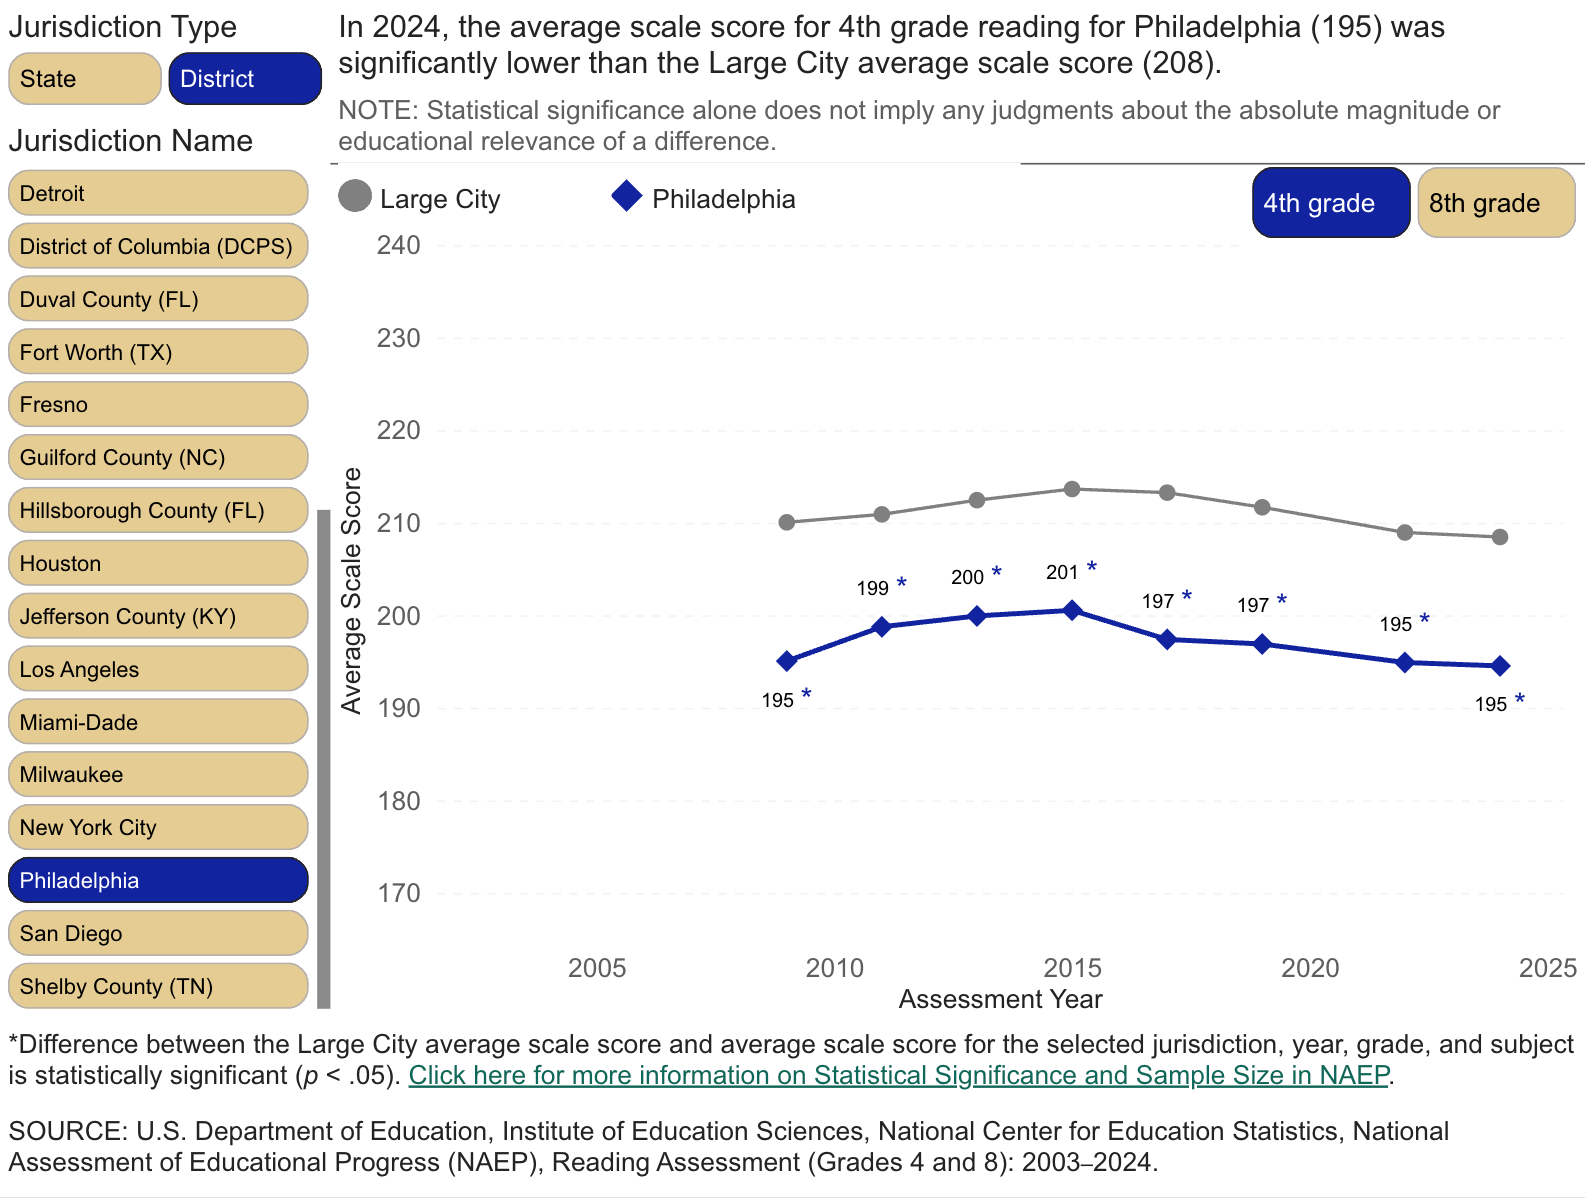
And another page gives us clear information about "Statistical Significance and Sample Size", which describes how to interpret differences in results among groups of students on a given year's test. So it's clear what it means to say that "In 2020, the average scale score for 4th grade reading in Philadelphia (196) was significantly lower than the Large City average scale score (208)":
But it's not at all clear to me what it means to say that "2024 NAEP Reading Scores Decline, Adding to a Decade of Declines". Are students not as good at reading as they used to be? Or have the tests (or the grading standards) gotten a little harder?
My second question is: How do they control for student engagement? Individual student scores are not calculated or reported, so students have no external motivation for giving a serious effort. The adults monitoring the test (sometimes from the NAEP and sometimes local) will notice obvious disengagement, and failure to answer questions will be clear after the fact. But there's a significant range between total failure to answer (which apparently does happen) and doing your best. So even if the questions and grading standards are comparable, how do we know that lower average scores mean that students haven't learned as much, rather than that they're less motivated to try hard on a test that they won't be graded on?
These questions are not meant as a criticism of the NAEP process or its results. There are probably good answers, especially to the question about norming tests over time. And there's been some research on the engagement question, e.g. Allison LaFave et al., "Student engagement on the national assessment of educational progress (NAEP): A systematic review and meta-analysis of extant research", 2022:
This systematic review examines empirical research about students’ motivation for NAEP in grades 4, 8, and 12 using multiple motivation constructs, including effort, value, and expectancy. Analyses yielded several findings. First, there are stark differences in the perceived importance of doing well on NAEP among students in grades 4 (86%), 8 (59%), and 12 (35%). Second, meta-analyses of descriptive data on the percentage of students who agreed with various expectancy statements (e.g., “I am good at mathematics”) revealed minimal variations across grade level. However, similar meta-analyses of data on the percentage of students who agreed with various value statements (e.g., “I like mathematics”) exposed notable variation across grade levels. Third, domain-specific motivation has a positive, statistically significant relationship with NAEP achievement. Finally, some interventions – particularly financial incentives – may have a modest, positive effect on NAEP achievement.
The data in the full paper (and the surveyed publications) make it clear that there are large differences among (groups of) students in how important they said it was to do well on the NAEP, and how hard they said they tried in taking it. And the reported data also makes it clear that those differences predict NAEP score outcomes, in the obvious way. There does not seem to be any data about engagement or motivation changes over time — but it seems plausible to me that such changes might exist, and someone may have documented them.
(For a bit more about the linguistic relevance of this question, see the earlier discussion of Bill Labov's "Bunny paper".
