Bar chart of the week
Junk Charts 2016-05-06
From the IMF, using OECD data, (via Sam Warburton)
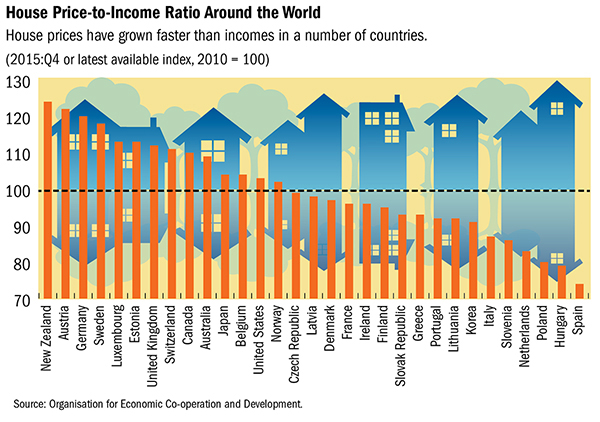
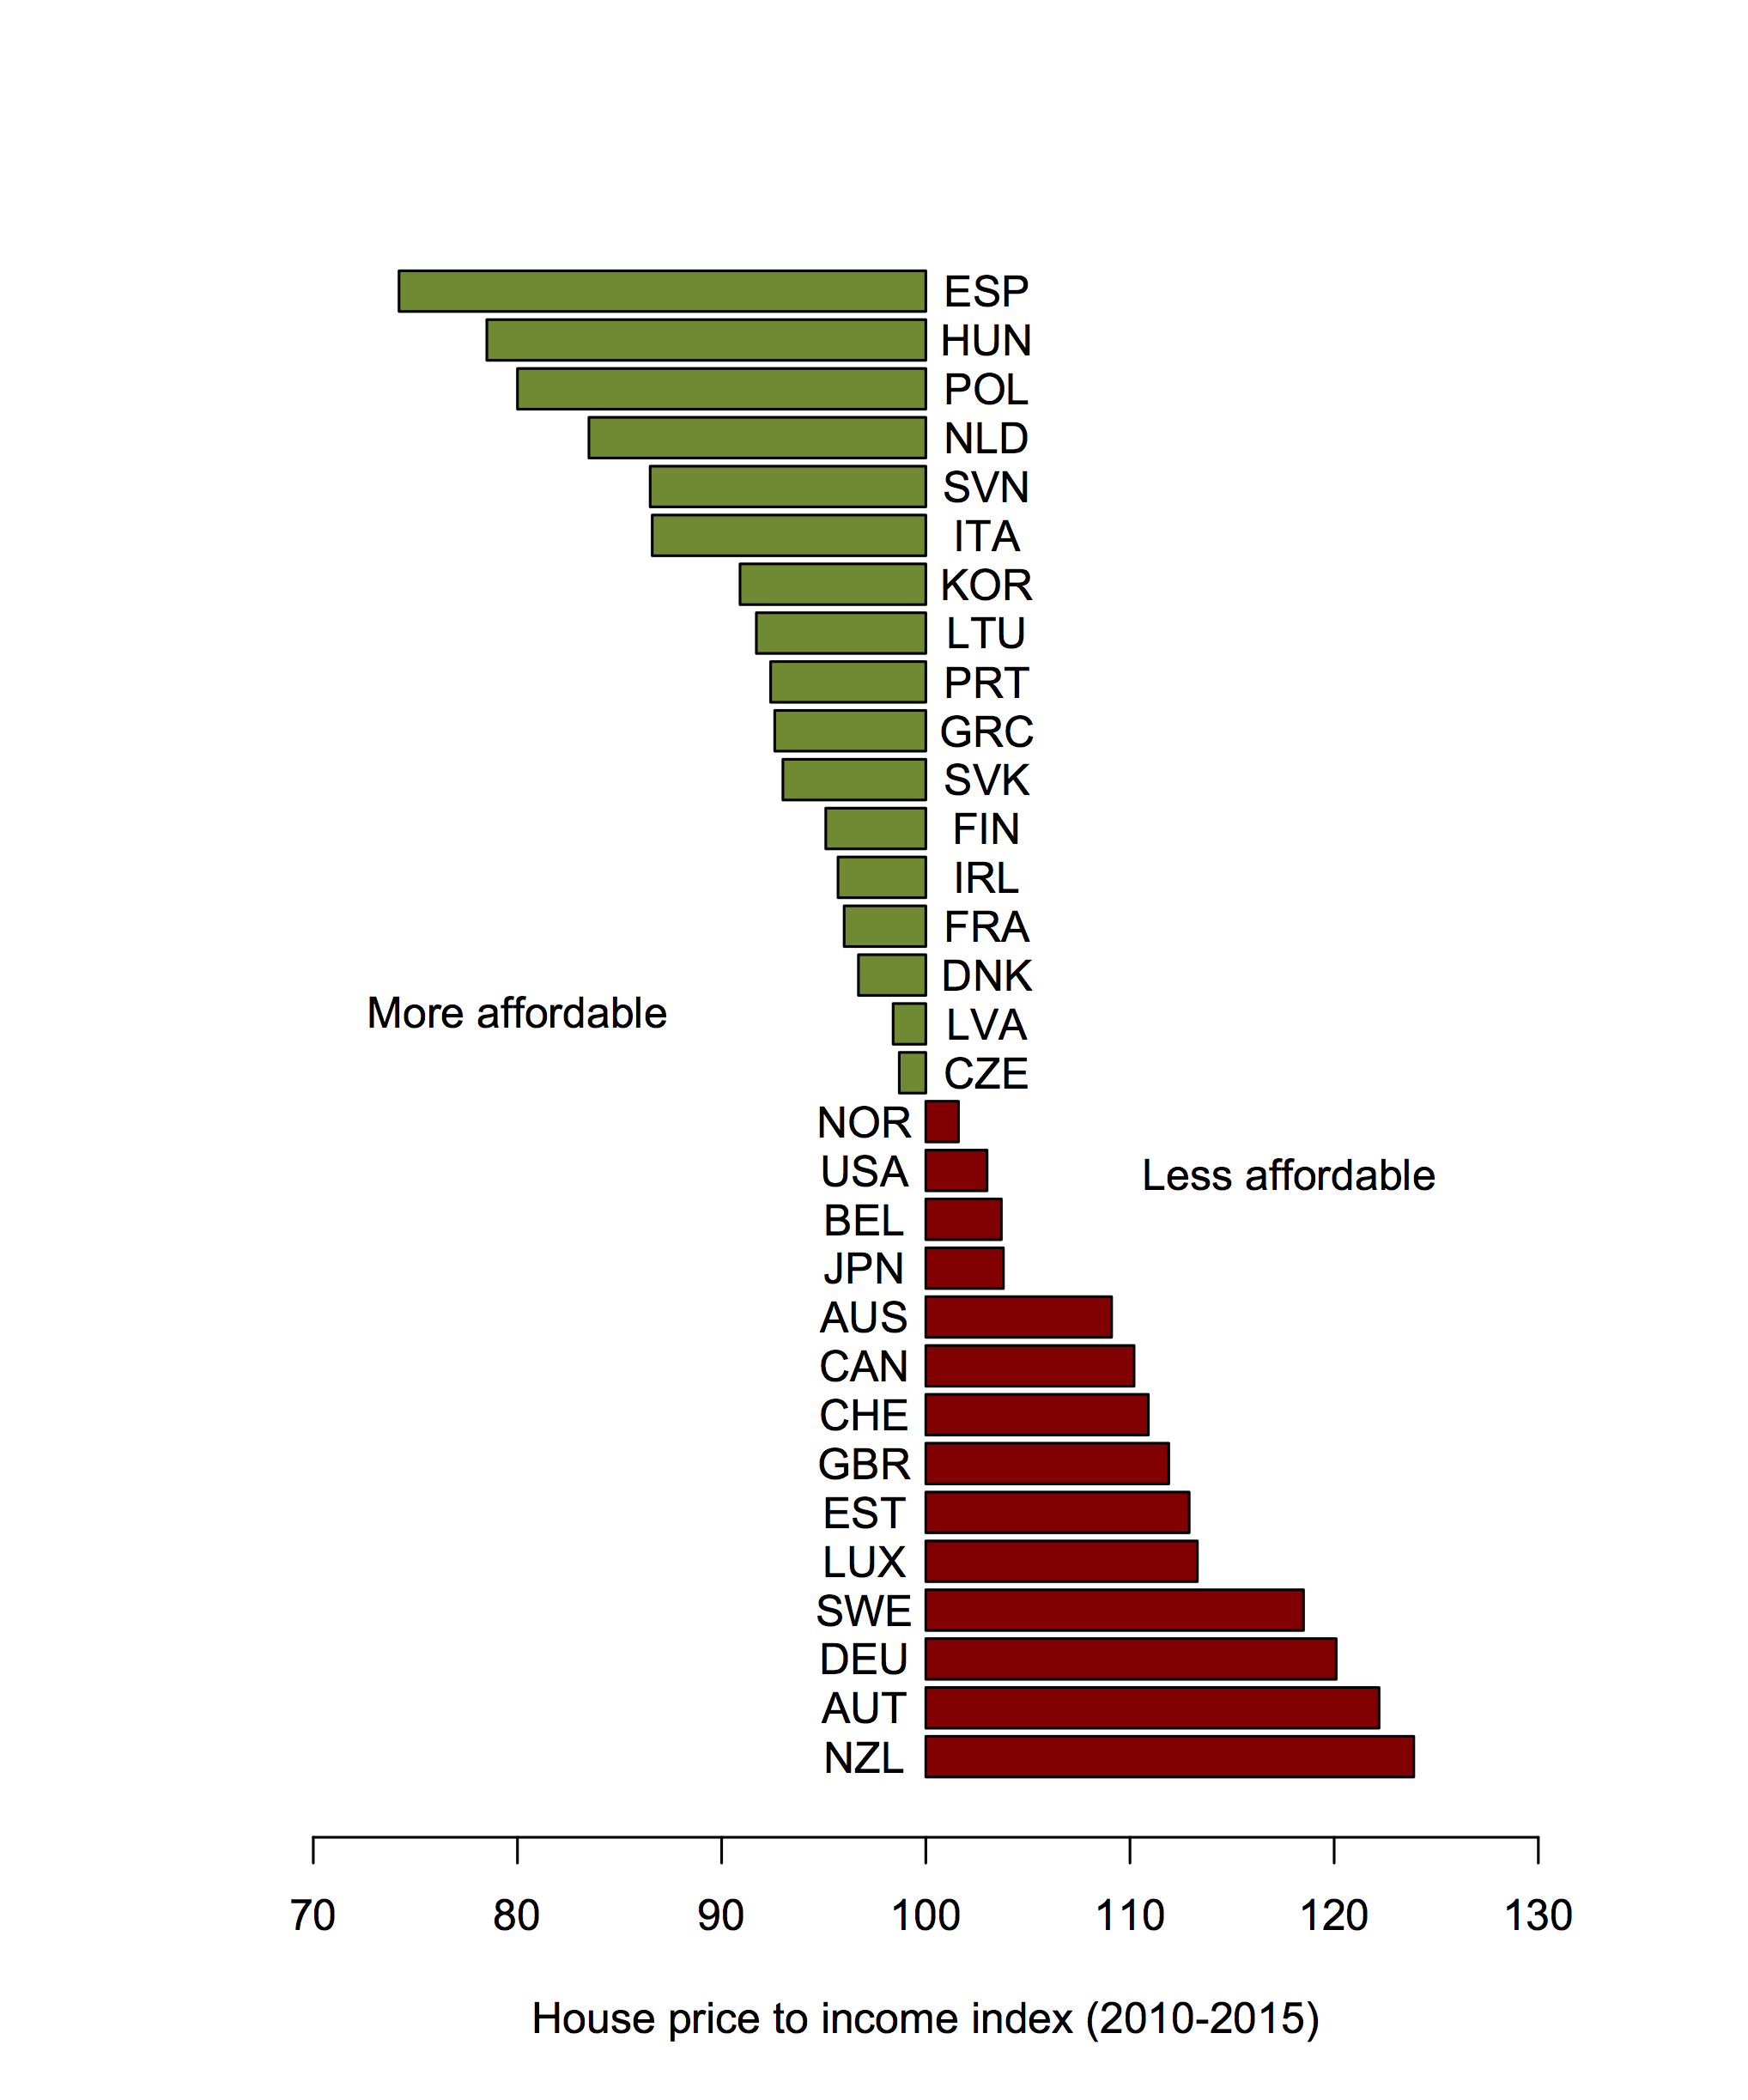
Bar charts should start at zero (and probably shouldn’t have distracting house/arrow/tree reflections in the background), but this graph would look even worse if the y-axis went down to zero. The problem is that ‘zero’ isn’t 0 for this sort of measurement. The index is the price:income ratio now, divided by the price:income ratio in 2010, multiplied by 100. The “no change” value is 100, which suggests using that for the floor of the bars. Making the bars wider relative to the spaces gives easier comparisons and makes the graph less busy. The colour scheme isn’t ideal for dichromats, but it only reinforces the information, it’s not needed to interpret anything.
The next step, as Sam suggested on Twitter, would be to give up on the ‘index’, which is really economist jargon, and just describe the change in %. He also suggesting putting the two labels in colour (which required some fiddling: for the text colour to look like the bar colour it has to actually be darker).
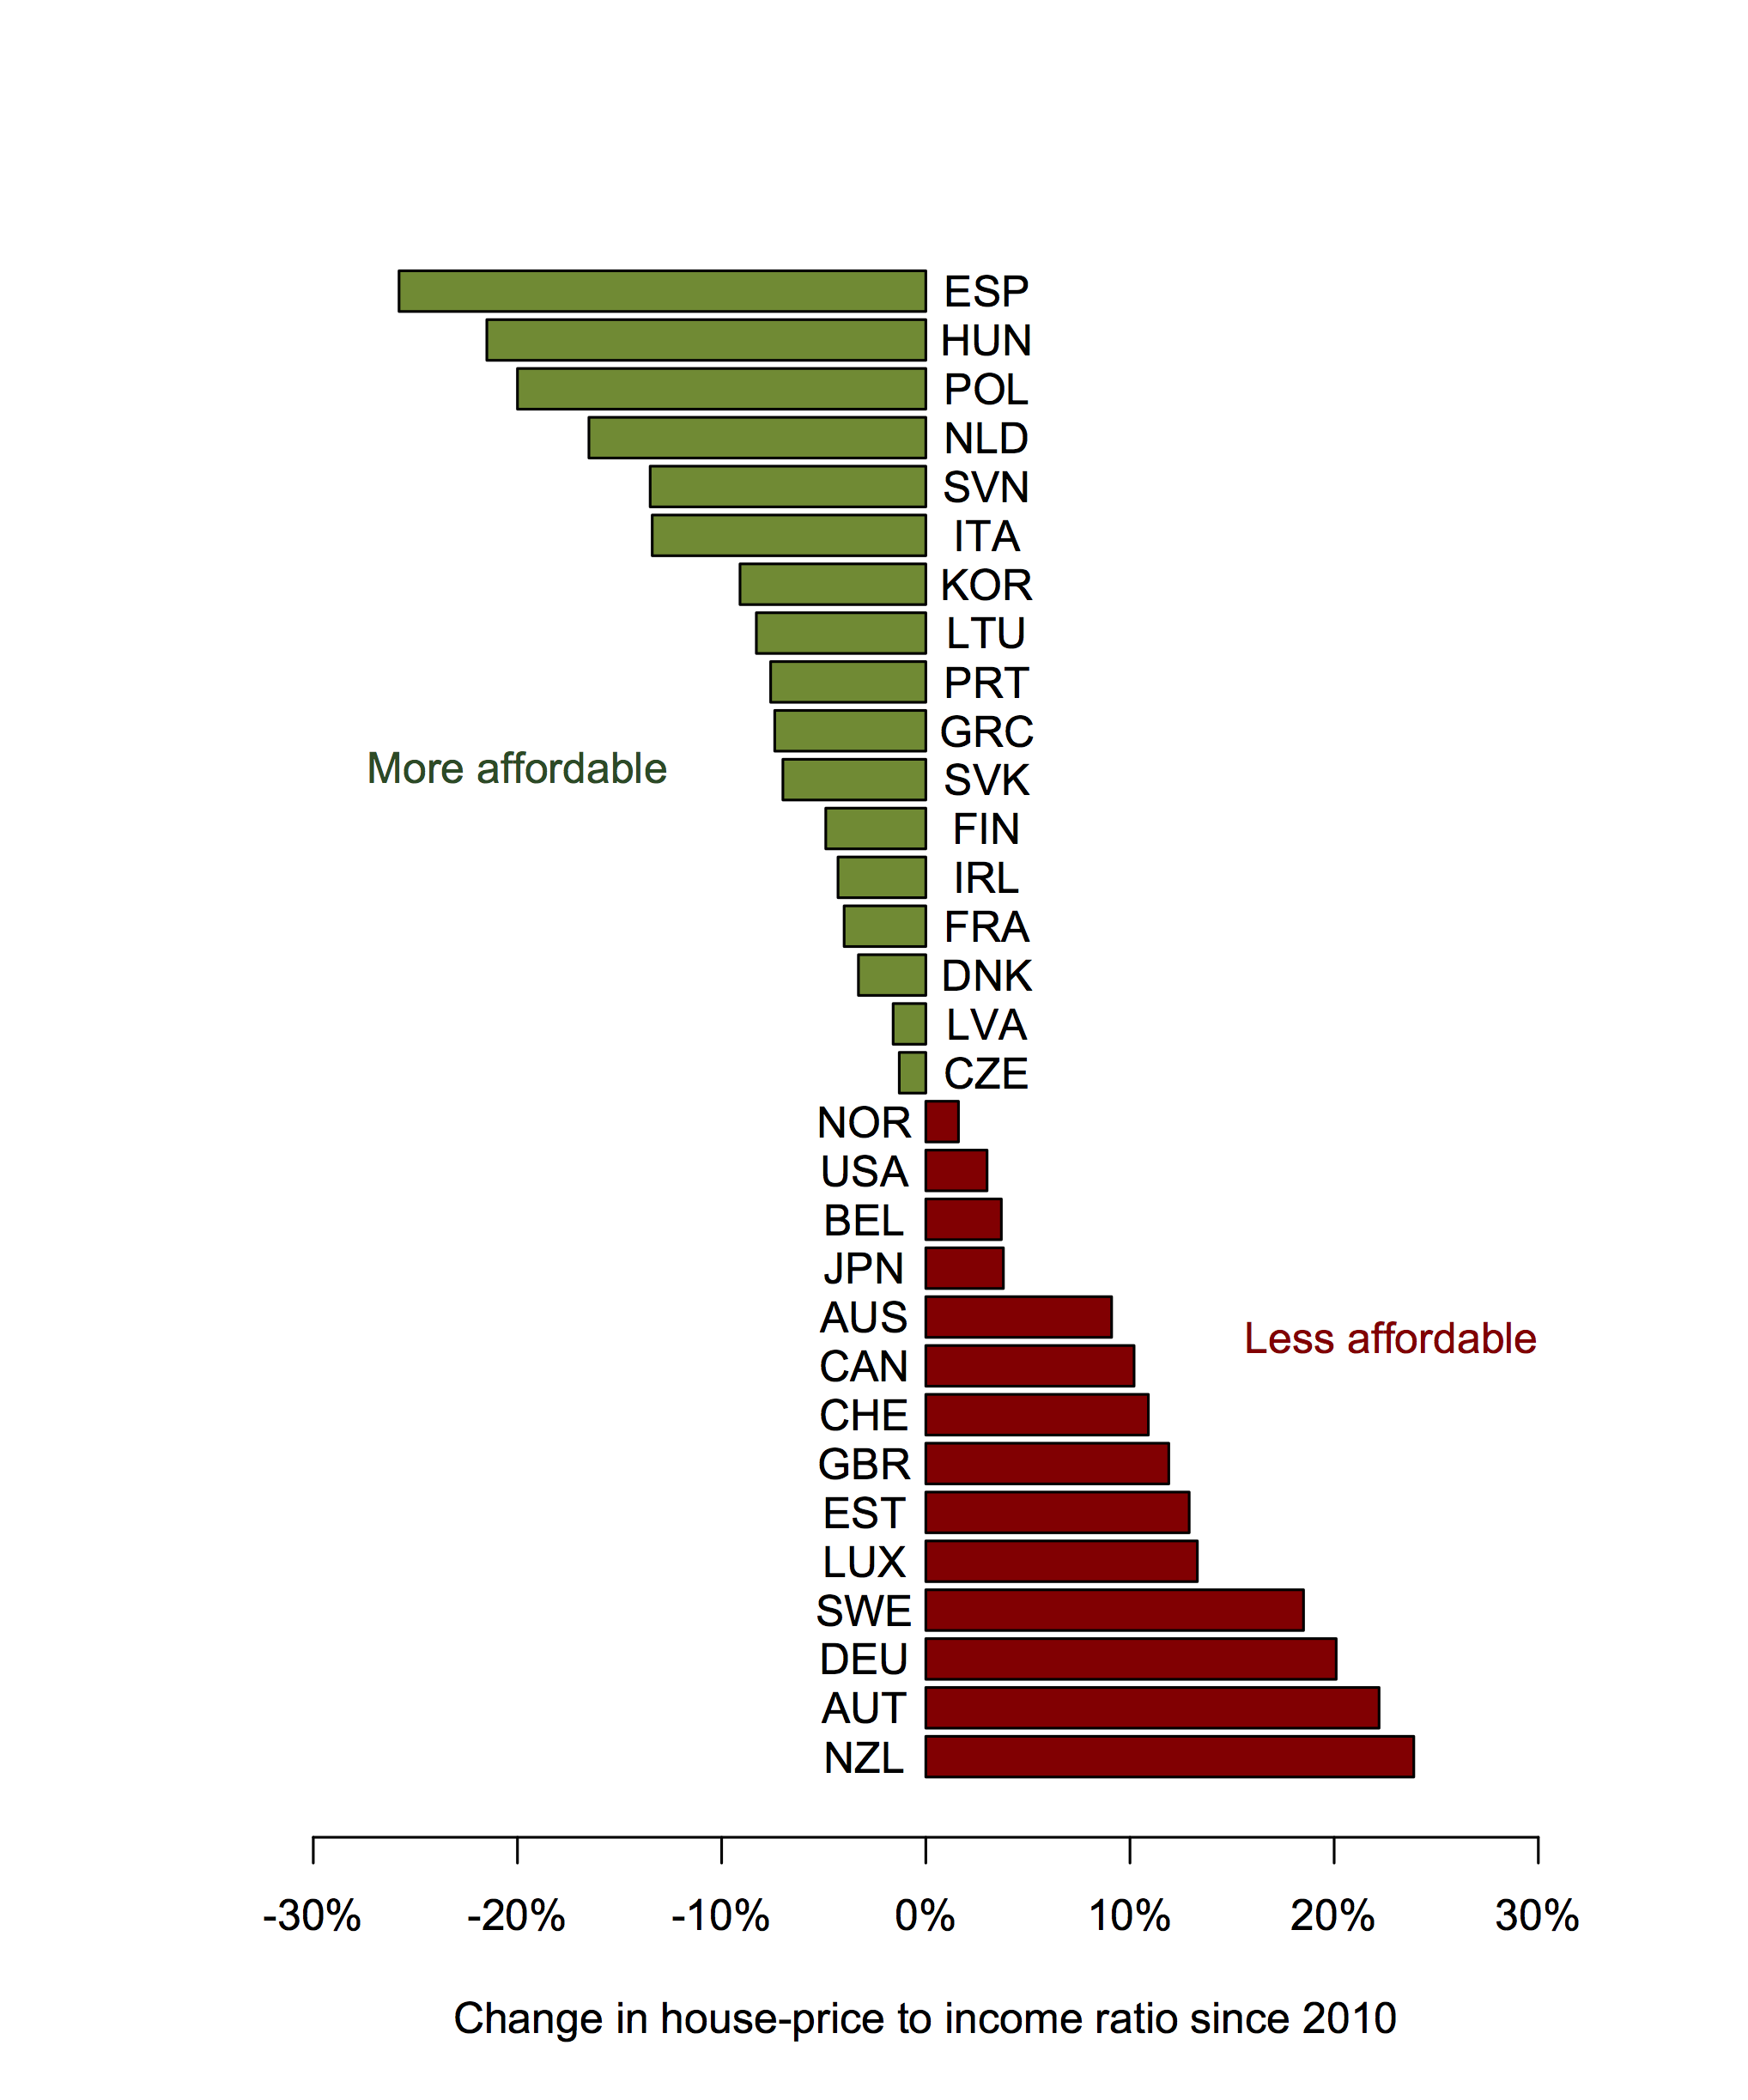
One might also go back to the full names of the countries, but I quite like the abbreviations.