Passing-Bablok Regression: R code for SAS users
R-bloggers 2013-09-03
While at the Joint Statistical Meeting a few weeks ago I was talking to a friend about various aspects to clinical trials. He indicated that no current R package was able to perfectly reproduce Passing-Bablok (PB) regression so that it exactly matched SAS. He ultimately wrote a couple of functions and kindly shared them with me so that I could share them here.
There is currently an R package (mcr) that will do the Passing-Bablok regression but, as it turns out, the output does not precisely match SAS. Sadly, I don’t currently have a copy of SAS available to use for this purpose so I can’t independently run code and comparisons. Though I would be interested in an equivalent comparison. However, I ran some examples below to compare the R mcr package.
These code snippets that he shared with me will only calculate the slope, intercept and the confidence interval for each coefficient. It’s not CRAN package ready but the short function and output are convenient and easy to use.
One interesting characteristic comparing the two PB regressions (at least in the simulation below) is that the mcr package always has a slightly smaller coefficient. In the simulation below the maximum difference is .00054. The minimum difference is somewhere along the lines of zero (1.59e-12). The details of the differences is something I must look into at a later date.
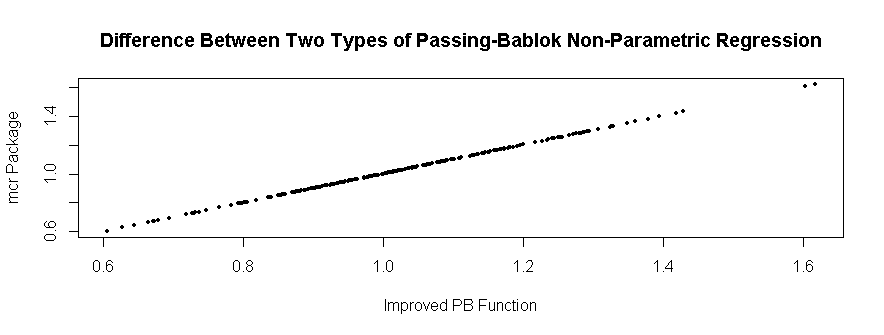
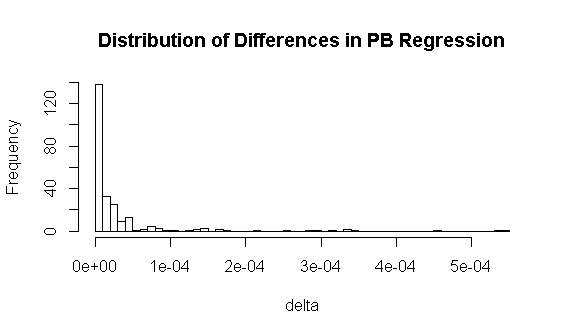
library(mcr)# Function to generate some correlated datagenData = function(numobs=100,randval){R = matrix(cbind(1,.80, .80,1),nrow=2)U = t(chol(R))nvars = dim(U)[1]set.seed(randval)random.normal = matrix(rnorm(nvars*numobs,100,10), nrow=nvars, ncol=numobs);X = U %*% random.normalnewX = t(X)raw = newXreturn(raw)}PB.reg = function(X,Y,alpha=.05) {## (1) calculate all pairwise slopesx < - Xy <- Ydat <- cbind(x,y)n <- length(x)S <- array(NA,dim=rep(n,2))for(i in 1:(n-1)){for(j in (i+1):n) {if(i != j) {S[i,j] <- (y[i] - y[j])/(x[i] - x[j])}}}S <- sort(na.exclude(as.vector(S)))K <- sum(S <= -1) - .5 * sum(S == -1)N <- length(S)b <- ifelse(N%%2,S[(N+1)/2+K],mean(S[N/2+K+0:1]))### CI for bC.gamma <- qnorm(1-alpha/2) * sqrt(n*(n-1)*(2*n+5)/18)M1 <- round((N-C.gamma)/2,0)M2 <- N - M1 + 1CI.b <- c(LB=S[M1+K],UB=S[M2+K])a <- median(y - b*x)### CI for aCI.a <- c(LB=median(y - CI.b["UB"]*x),UB=median(y - CI.b["LB"]*x))##return(list(a=a, CI.a=CI.a, b=b, CI.b=CI.b))}# A quick function to give only b coefficientPB.fit.red = function(X,Y){fit.lm = PB.reg(X, Y)fit.lm$b}# Generate some one-time use correlated datasimData = genData(numobs=20,c(12345))# Updated functionpb.fit = PB.reg(simData[,1], simData[,2])# Look at just the b coefficient, single examplePB.fit.red(simData[,1], simData[,2])# mcreg function, single examplepb.fit2 = mcreg(simData[,1], simData[,2], method.reg="PaBa", method.ci="bootstrap")slot(pb.fit2, "glob.coef")[2]&amp;amp;nbsp;# Run a small simulationnsims = 250sim.data = matrix(NA, nrow=nsims, ncol=2)# for() loop used for demonstration purposes.# Not efficient code applying a function over the vectors is more efficientfor(i in 1:nsims){simData = genData( numobs=20, i )# Look at just the b coefficient, multiple simulationssim.data[i,1] = PB.fit.red(simData[,1], simData[,2])# mcreg function, multiple simulationspb.fit2 = mcreg(simData[,1], simData[,2], method.reg="PaBa", method.ci="bootstrap")sim.data[i,2] = slot(pb.fit2, "glob.coef")[2]}delta = sim.data[,1] - sim.data[,2]mean(delta)max(delta)min(delta)hist(delta, nclass=50, main="Distribution of Differences in PB Regression")plot(sim.data, main="Difference Between Two Types of Passing-Bablok Non-Parametric Regression",xlab="Improved PB Function", ylab="mcr Package")
R-bloggers.com offers daily e-mail updates about R news and tutorials on topics such as: visualization (ggplot2, Boxplots, maps, animation), programming (RStudio, Sweave, LaTeX, SQL, Eclipse, git, hadoop, Web Scraping) statistics (regression, PCA, time series, trading) and more...