Confused by Party ID fluctuations in polls? They Are Probably Telling Us Something about Confounding Variables
technosociology 2012-10-10
There is a lot of hand-wringing and second guessing about the polls this election season. One point of contention seems to be whether the samples of some pollsters are skewed towards one party or the other. A lot of this speculations stems from the fact that voters who self-identify as one party or the other seem to fluctuate from poll to poll, even by the same pollsters. How can something fluctuate this much and still produce useful data?
To understand this, we need to untangle sources of error and fluctuations in poll results and also understand confounding variables. (It is not difficult but requires a bit of information and bit of thinking through).
First, all polls based on samples (rather than surveying the whole population like a census) have a “margin of error“, usually around plus or minus 2-3 percent for national polls such as Gallup, Pew. This margin of error should be understood in light of the “confidence interval” which is often not reported but is almost always 95%. This means that, 95% of the time, the sample results will be plus or minus 2-3 percent of the actual results of the whole population. So, even if everything was perfect and the sample was completely random, we would be off by more than 3 percent in either direction 1 out of 20 times (5% of the time). (Why don’t we have a smaller margin of error? Because the margin of error moves with the square root of the sample size–the relationship is exponential, not linear so you don’t get three times improvement when you go from a sample of 1500 to a sample of 4500. See rough chart or play yourself with the calculator here. So it would be really costly have a sample large enough (about 10,000 in the US) to get the margin of error under one percent. ).
Hence, a few percent fluctuations are to be expected from poll to poll even if everything is done just right.
Second, there are systemic errors because samples are rarely purely random. All our regular (frequentist) statistics depend on the Central Limit Theorem which assumes a purely random sample.
Random in the context of polling means that every single potential respondent in the population has an exactly equal chance of being included in the poll. Well, this never works, no matter the method. Different kinds of people may have different odds of being at home. Note that the problem isn’t that some people aren’t at home. That would be fine. The problem is being at home is associated with being a different kind of voter. For example retirees may be more likely to be at home compared to younger respondents. Young respondents are more likely to have cell-phone only homes and are underrepresented in landline only polls. Again, this would be okay if we could assume that cell-phone only voter patterns look exactly like voting patterns of landline people. There is good reason to think not.
Pollsters deal with the fact that their sample is not purely random by weighting their samples by known quantities. In the United States, we know the pretty reliably the percentages of gender, race and age distributions–at a pretty fine level, too. So, if my sample is 55% female and I know the voting age US population is about 52% female, I can adjust my sample calculations so that a woman in my sample counts slightly more *as if* my sample had the expected distribution of gender. Most pollsters and surveys do this and this is a well-tested and reliable method as long as the samples are not too small and the weighting is done according to well known population parameters.
Third, there can be fluctuations because of underlying changes to the actual variable (which you want to measure) *or* the willingness of respondents to answer polls (which you usually want to discount but in the case of voter surveys, you should not because willingness to answer pollsters is likely predictive of election outcomes as well).
So, here comes Party-ID. First question is whether to treat it as a stable population parameter by which to adjust our samples, or whether to see it as a variable. There is good reason to argue that it may well be stable and there is some work that suggests that it is indeed durable. On the other hand, since it is indeed fluctuating in so many polls, and we know that it has fluctuated between elections as measured by more reliable exit polls, it is reasonable to treat it as a changing variable measuring something. In other words, if it is fluctuating so much, does it indicate regular measurement error due to statistical fundamentals of sampling (i.e. you can’t escape some level of variation) or could it be measuring something else? I vote for the latter, given available evidence of fluctuation.
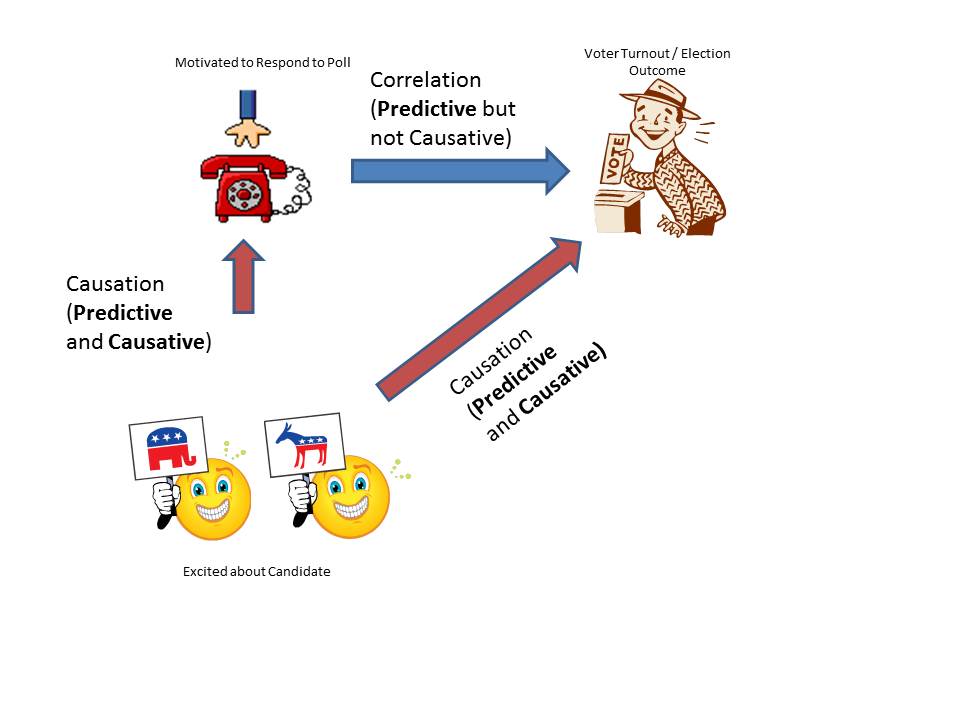
I believe that a reasonable argument is that party ID measures a combination of enthusiasm, willingness to respond to polls and willingness to be persuaded by a party so that you self-identify as a supporter rather than an “independent.” In other words, let’s assume you are lukewarm towards candidate A from political party AA but then something happens and you are excited about candidate A. Your phone rings. “I’m calling from Survey firm XYZnonsleazy pollster and I’d like to ask you a few questions about the upcoming elections.” You are probably more likely to take that minute to answer that question if you are excited about your candidate and the election compared with “your uninterested in the whole thing” state. Plus, maybe, before you got excited, you identified as an independent. Now you are excited about candidate A so you self-identify as party AA.
Hence, persuading fence-sitters and exciting supporters can easily result in a sample that has a higher party-ID proportion compared with one taken a few days ago among a less excited, less-persuaded crowd. In other words, partisans and fence-sitters closer to the other side may well be sitting out the poll.
Okay, you say, that means that the poll is less reliable because the sample is skewed and is leaving out some folks. Ah, yes, but it is quite likely that the effect on the election is just as real as party-ID may be a proxy for a confounding variable, excitement and likelihood of voting, which is well-known to strongly influence election results.
What are confounding variables? They are the reason you should run, most of the time, when someone says “correlation does not equal causation” without saying anything more substantive. If there is persistent correlation, something is going on and people should try to figure it out before deciding that something is substantive and of interest to you or not.
A classic example of a confounding is that ice-cream sales and murder rates are correlated. It’s not because we all scream for ice cream and pull out guns in frustration, but it is because there is a confounding variable: summer. Summer is correlated with both ice cream and higher murder rates. In this case, it is highly unlikely that you are interested in this relationship and likely not going to track ice cream sales to predict murders because you may as well look at the temperature–you have direct access to the causative variable.
But, in many cases, the confounding, hidden variable is of great interest because we don’t have access to the confounding variable–which is sometimes referred to as “hidden variable” exactly because we don’t have access to it.
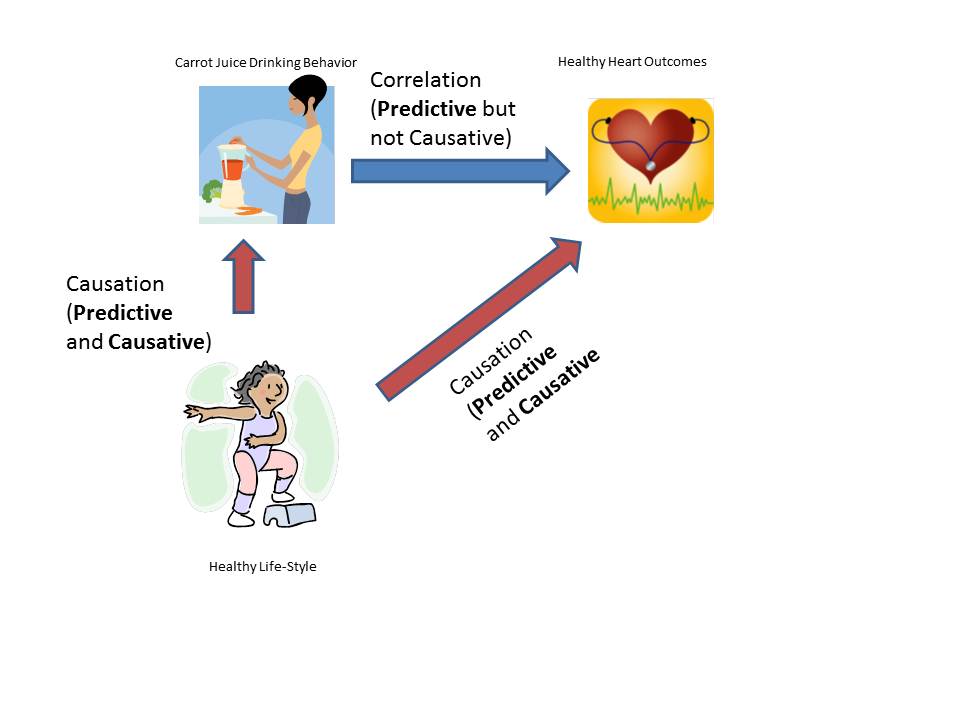
Let’s say you find that people who drink carrot juice regularly are less likely to suffer from cancer. Shall we break open the juicer? Probably not because the likely confounding variable is people interested in a healthy lifestyle. People who are drinking carrot juice are likely taking better care of their health in other ways too because that’s just the kind of people they are. So, carrot juice is a proxy (stand-in) for healthy behaviors. But what if all you could measure was whether people drank carrot juice? I’d argue that it would be perfectly reasonable to use it as a predictive variable while also understanding that the relationship was not causative, but went through a confounding variable. What you should NOT do is prescribe carrot juice. (This stuff is serious and compplicated. This what went wrong with the infamous error when women were recommended hormone replacement therapy thinking it reduced cancers when, in fact, it increased them and the previously observed effect was due to a confounding variable–women who took HRT were probably more health-conscious to begin with).
In polling for elections, it is quite likely that party-ID is like drinking carrot juice. It signals something and, as a signal, it is useful. Hence, if party-ID trend goes in consistent direction from poll-to-poll from the same pollster, it is perfectly reasonable to assume that it is a proxy for a hidden variable, excitement and state of being persuaded of the voter base. (Also keep in mind that there will be small fluctuations due to unavoidable margin of error but those should cancel out over the long-term as the error can be in any direction).
Hence, fluctuating party-ID can function as a predictive variable even though it is not actually the causative variable. The fluctuations in this variable are probably a combination of sample fluctuations (normal and expected and happens with all variables within the margin of error 19 out of 20 times (95% confidence interval) and outside the margin of error 1 out of 20 times PLUS fluctuations in actual voter dispositions. While we cannot tease apart which part of the fluctuation comes from which part, it is safe to assume that statistical fluctuation will even itself out over multiple polls while the structural part that comes from voter excitement and engagement making people shift their self-perception and willingness to answer pollsters, can be useful and predictive even though it is, indeed, correlation not causation.

