Awesome online graph guessing game. And scatterplot charades.
Statistical Modeling, Causal Inference, and Social Science 2024-09-10

Julian Gerez points to this awesome time-series guessing game from Ari Jigarjian. The above image gives an example. Stare at the graph for awhile and figure out which is the correct option.
I don’t quite know how Jigarjian does this—where he gets the data and the different options in the multiple-choice set. Does he just start with a graph and then come up with a few alternative stories that could fit, or is there some more automatic procedure going on? In any case, it’s a fun game. A new one comes every day. Some are easy, some not so easy. I guess it depends primarily on how closely your background knowledge lines up with the day’s topic, but also, more interestingly, on how much you can work out the solution by thinking things through.
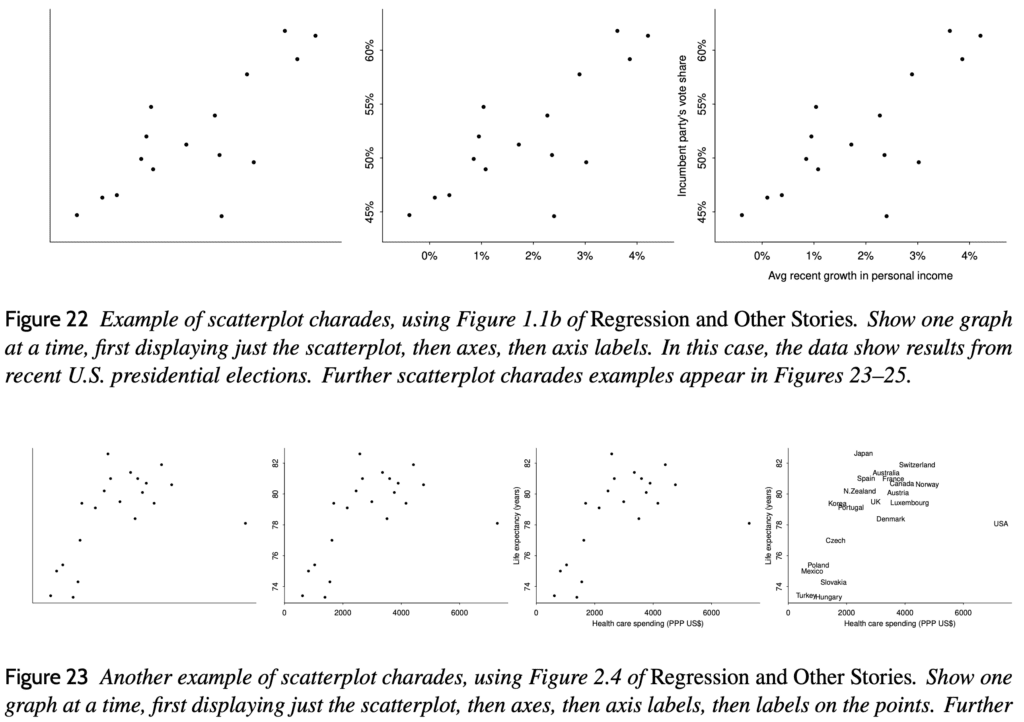
This graph guessing game reminds me of scatterplot charades, a game that we introduce in section 3.3 of Active Statistics:
Students do this activity in pairs. Each student should come to class with a scatterplot on some interesting topic printed on paper or visible on their computer or phone, and then reveal the plot to the other student in the pair, a bit at a time, starting with the dots only and then successively uncovering units, axes and titles. At each stage, the other student should try to guess what is being plotted, with the final graph being the reveal.
In the book we give four examples. Here are two of them:

The time-series guessing game is different than scatterplot charades in being less interactive, but fun in its own way. The interactivity of scatterplot charades makes for a good classroom demonstration; the non-interactivity of the time-series guessing game makes for a good online app.