What if the polls are right? (some scatterplots, and some comparisons to vote swings in past decades)
Statistical Modeling, Causal Inference, and Social Science 2024-11-04

There’s a lot of talk about how the polls can go wrong. Fair enough—I wrote an article a few years ago on failure and success in political polling and election forecasting, and a few years before that, Julia Azari and I wrote about the 19 things we learned from the 2016 election. From historical patterns, we’d expect the polls to be off in some way that we can’t predict right now.
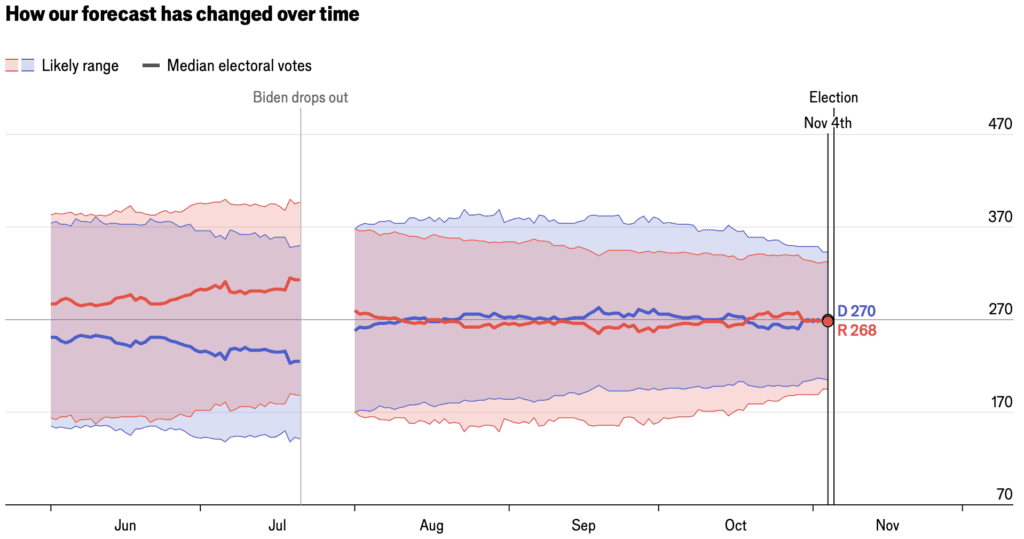
But, before the election is done and we remain in a state of ignorance, with the coin spinning above us in the air, let’s look at what the poll-based forecasts say.
What if the polls are right?
The focus is, understandably, on which party will win the national election, but here I want to let’s look at all 50 states. I’m pulling the latest state-by-state forecast of the candidates’ two-party vote share from the Economist’s model (for which we supply here some statistical background here).
Here’s the forecast swing from 2020:

We can zoom in on the swing states:

Don’t overinterpret those points near 50%—the forecast has a lot of uncertainty!
Now let’s look at all 50 states again, but I’ll plot it as the forecast swing from 2020:

As I’ve said many times, different forecasts can use different methods, but they’re all using pretty much the same data, so different reasonable forecasts should come to similar conclusions. Indeed, if you go over to our friendly competitors at Fivethirtyeight, you’ll see very similar point forecasts for the states. There are some slight differences for the less competitive states, as you can see when we redo the graph of the forecast swing:

Non-swing states are polled much less frequently so their forecasts are more dependent on hard-to-validate model choices. The focus is on getting things right—or, maybe I should say, to avoid being embarrassed—in the national forecast and thus in the swing states. (For further discussion of incentives for election forecasters, see this article from 2020 and this post from 2024.) The other 40 or so states pretty much just come along for the ride, and usually we don’t stare at our forecasts for them very carefully. They’re like those distorted images you can find in the periphery of a photo if you know where to look.
Just as a point of reference, here are the state-by-state swings from 2016 to 2020:

From a historical standpoint, all these swings are small. Here are some swings from past decades:


P.S. The above is just for the presidential election. Anyone who wants to type in the relevant numbers (yeah, that’s my ugly workflow!) can feel free to do something similar with Congress and relevant local races.