The answer to the how-many-significant-digits problem is the same as the answer to the what-to-graph problem: The click-through solution
Statistical Modeling, Causal Inference, and Social Science 2025-03-07

We sometimes have discussions on the blog warning people against displaying too many significant digits. For example, back in 2012 I asked, “Is it meaningful to talk about a probability of “65.7%” that Obama will win the election?”, and I answered, No, it is not. That last digit being displayed is essentially pure noise, and fluctuations in that digit tell us nothing at all.
For another example, I was once discussing a paper that reported, “Of the 914 sexual minorities in our sample, 134 (14.66%) were dead by 2008,” to which I replied that it’s poor practice to call this 14.66% rather than 15%—it would be kinda like saying that Steph Curry is 6 feet 2.133 inches tall—but this is not important for the paper, it’s only an indirect sign of concern as it indicates a level of innumeracy on the authors’ part to have let this slip in.
But then a colleague pointed me to this post entitled, “Please show lots of digits,” arguing that “this is how you catch frauds.”
Good point! This came up in the recent Venezuelan election. First the vote counts as reported:

And then with a bunch of extra decimal places:
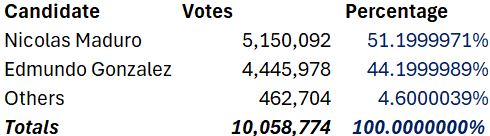
Those extra digits would serve no useful value—if we believed the numbers were correct. But the weirdness of the result is strong evidence that those exact vote totals are wrong, that they were reverse-engineered from the rounded values.
Here’s how Dean Eckles put it:
In some cases, reporting many digits can indeed be a costly signal — in that if they aren’t based on the stated calculations, it may be possible to figure out that they are impossible (e.g., via a granularity-related inconsistency of means aka GRIM test). This is perhaps one argument for at least reporting excess digits in tables (though not abstracts and press releases certainly!). Perhaps this argument is somewhat outdated if data and analysis code are provided in addition to results in a paper or report itself, though this remains not always the case.
The dilemma
On one hand, spew out a zillion digits every time and you’ll make your papers unreadable and even misleading. The author of that linked post refers to this as a “petty writing style opinion” and a “silly non-issue,” but . . . communication is important, and calling it “style” or “silly” doesn’t change that!
One way I explain this to students is by saying: Just as, when writing an article, you shouldn’t include a paragraph you don’t want people to read, you also shouldn’t include a table full of numbers you don’t want people to look at. People’s attention is limited, and that’s how it should be.
On the other hand . . . yeah, there can be gold in them thar decimal places. This came up in our recent description of election forecasts, where I praised The Economist for rounding their forecasts (I can’t remember their exact phrasing, but it was something like “even odds,” “3 out of 5 chance” “2 out of 3 chance,” etc., essentially presenting win probabilities rounded to the nearest of 50%, 60%, 66.6%, etc.), and a commenter responded that, sure, it’s good to not be misleading, but then there’s this awkward moment when the odds suddenly jump from approximately even to approximately 50% to approximately 60%, and that apparent discrete jump can itself be misleading. Also, as discussed in that linked post, extra decimal places can reveal problems in the analysis pipeline.
For another such example, check out this amusing story from James Heathers: “The data are on a 1-5 scale, the mean is 4.61, and the standard deviation is 1.64 . . . What’s so wrong about that??”
What to do, then?
My recommendation is what we’ve called the click-through solution: Start with an accessible summary that brings the reader in. Then click for statistical graphs that allow more direct visual comparisons. Then click again to get a spreadsheet with all the numbers and a list of sources.
In the context of a published article, step 1 would be the article itself, with appropriately rounded numbers (or, even better, graphs), step 2 is the supplementary information with full tables with additional decimal places, if that’s how you roll, and step 3 are the files with data and code. Do it all.