Buy your Tesla at closing time: For 15 years, these stocks have been mildly fluctuating during the day and shooting up overnight.
Statistical Modeling, Causal Inference, and Social Science 2025-04-19

Bruce Knuteson shares the above plot and writes:
Look at the strikingly suspicious overnight and intraday returns to Tesla’s stock noted by the Financial Times (cf. my rejoinder) and Forbes.
This suspicious return pattern in TSLA is easy to reproduce [data]. Nobody has articulated a plausible innocuous explanation for it. The only explanation that fits the facts is the market manipulation we have discussed. That has been the only explanation for nearly a decade now. Tesla’s stock is the source of much of Elon Musk’s wealth. The public still doesn’t know about this suspicious return pattern in the source of much of Elon Musk’s wealth because nobody has told them.
This has come up before, and it’s not just Tesla. Here’s a a graph that Knuteson sent me a couple years ago as evidence of market manipulation:
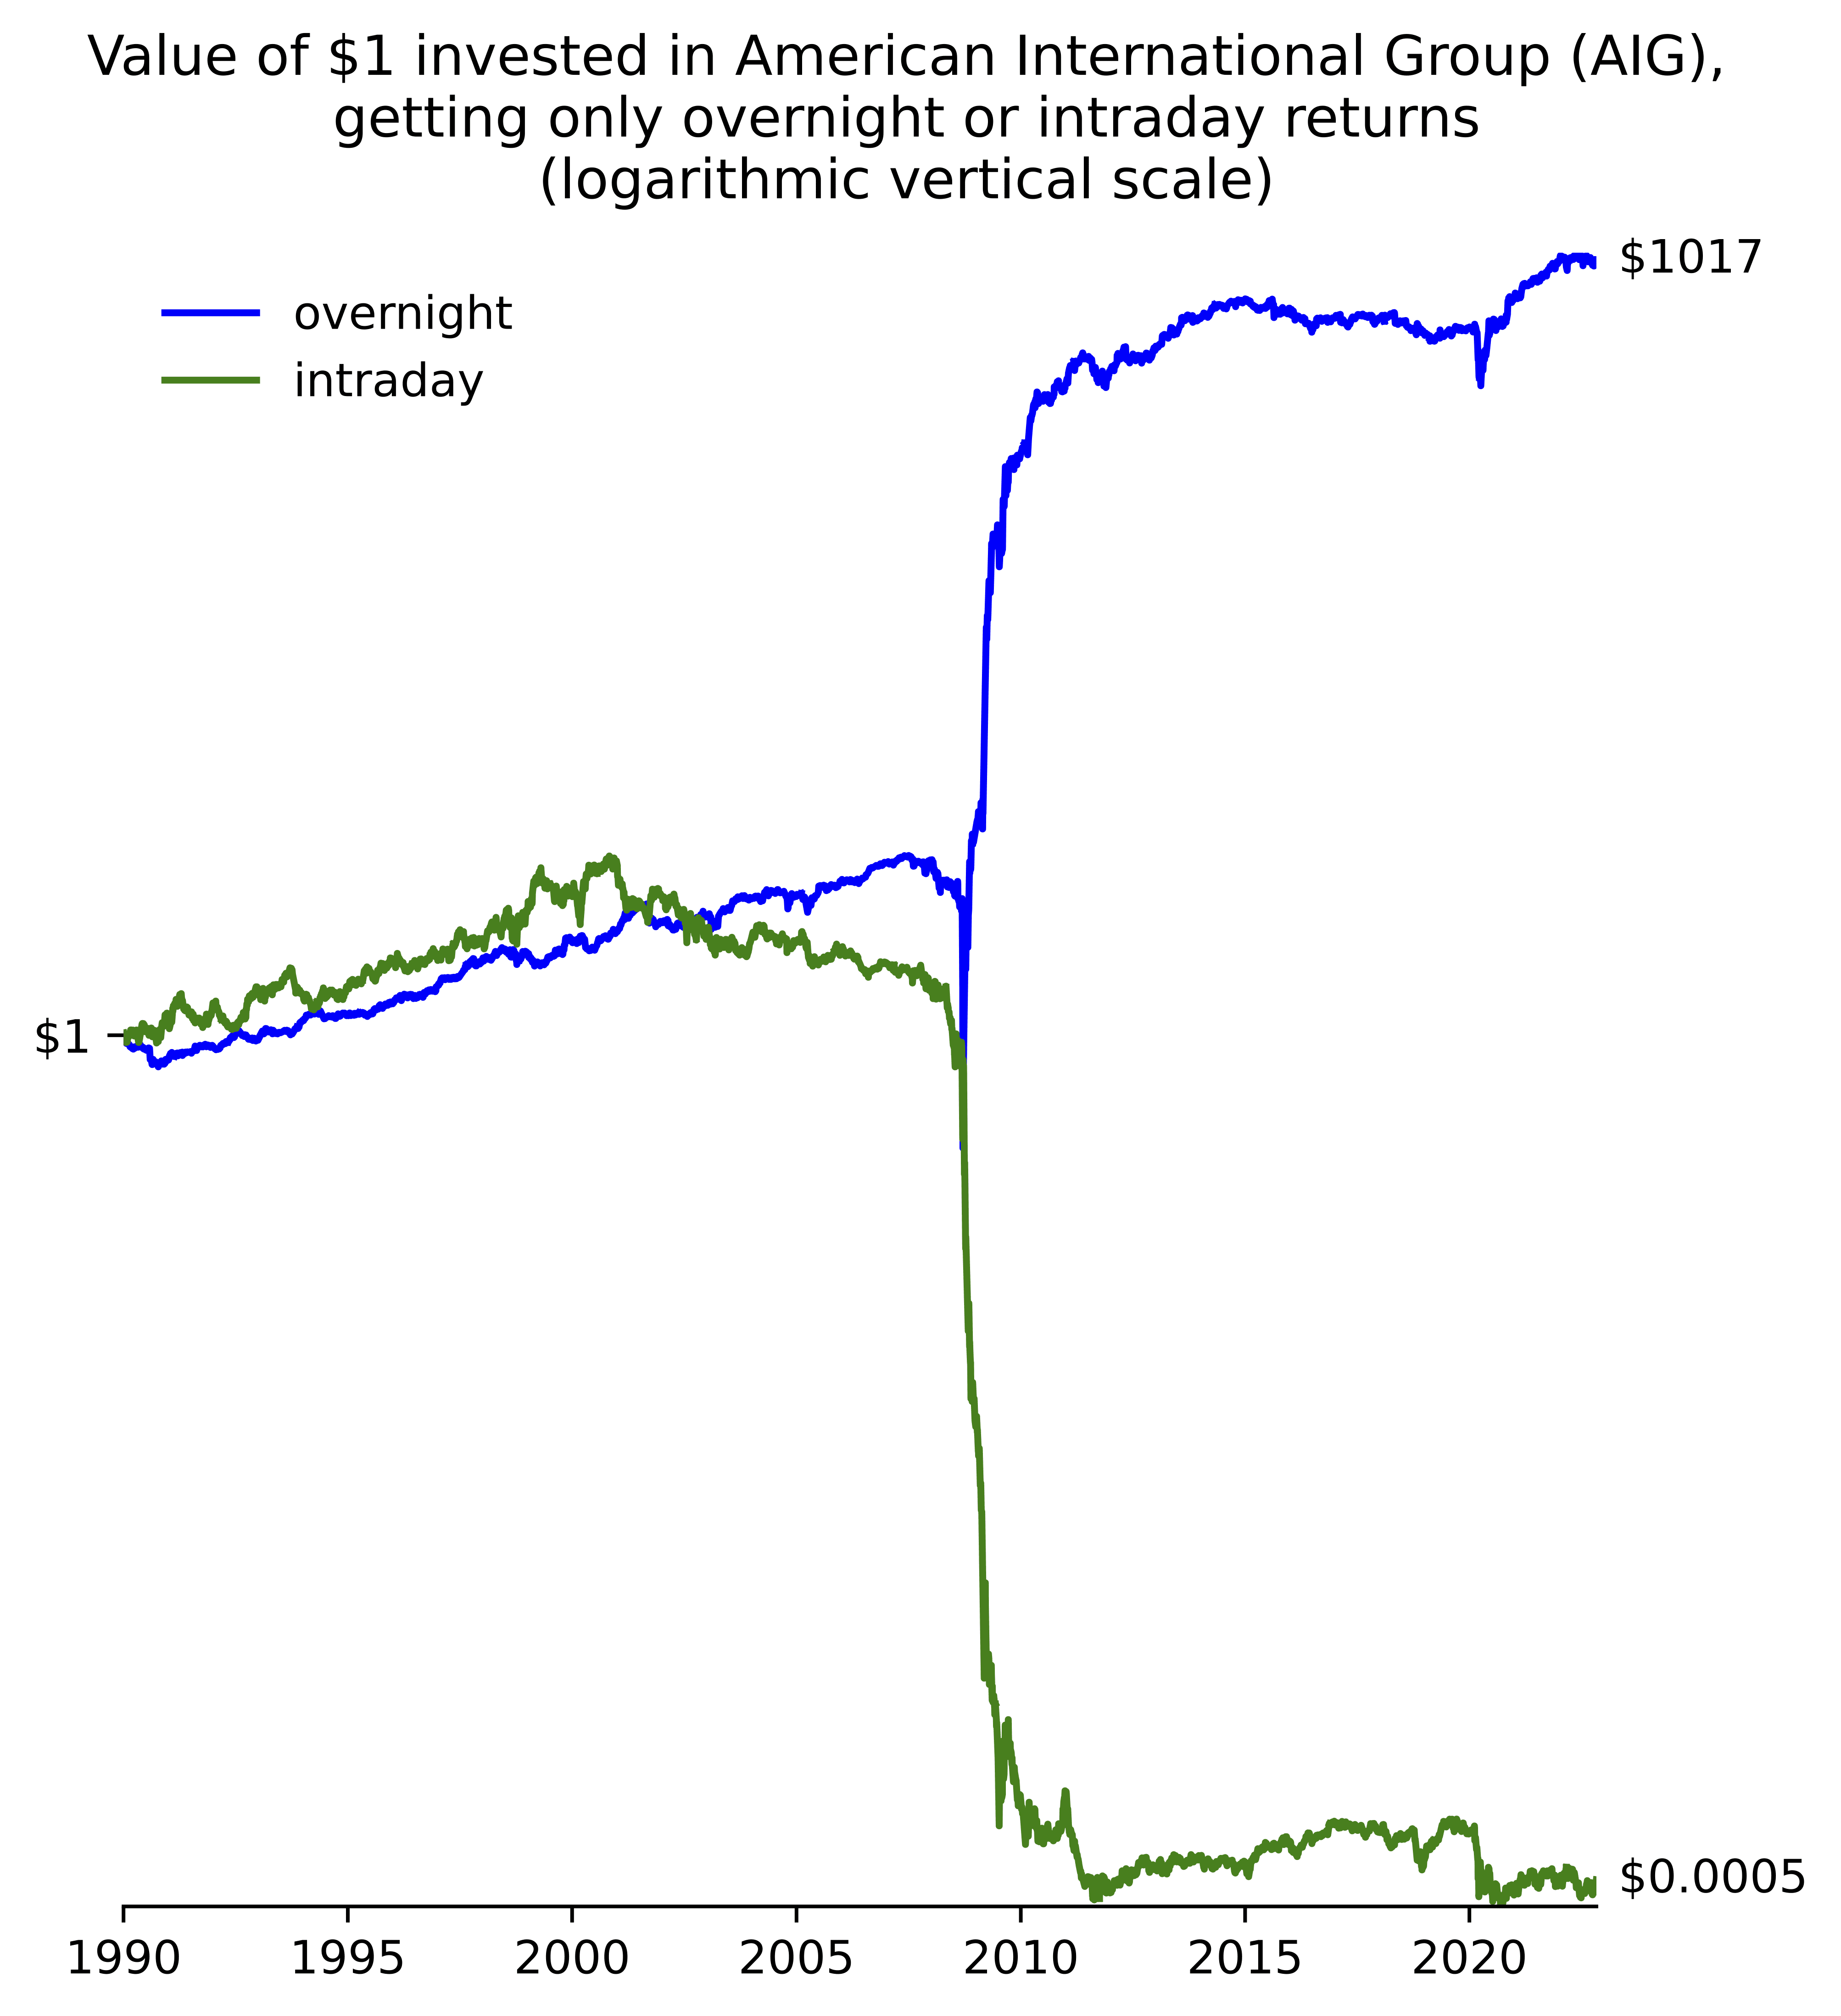
As I said at the time, I absolutely have no idea about this sort of thing. I ran into someone yesterday who used to work in financial markets and he was saying there was some class of high-volume traders who never like to hold onto assets overnight. And various theories came up in the comments to our previous post.
It’s an interesting statistical puzzles, in part because from my perspective it’s essentially impossible to understand without lots of subject-matter knowledge. And, unlike some other statistical puzzles (for example, the one discussed here) it’s a live issue.
One question that came up before is how this pattern looks for other financial assets. Knuteson shows a bunch of the relevant plots in this paper, for example:


Again, I entirely defer to others in trying to understand this one.
P.S. Knuteson also has this comment regarding the graphical displays:
