Here’s what’s happening with time-shifting of births.
Statistical Modeling, Causal Inference, and Social Science 2025-05-01
A couple weeks ago we discussed the question, “What day of the year will have the fewest noninduced births?”
It was an interesting difference between the reasoning of a mathematician (who focused on one factor–the loss of an hour in the day when Daylight Saving Time begins–while ignoring lots of other factors) and statistical reasoning (where we start with the data and see what we can find). As some commenters noted, ultimately we want to use both forms of reasoning, with statistical analysis backed up by mathematical modeling. From a “sociological” point of view, I found it interesting that the mathematician focused on such a minor aspect of the problem, it just happened to be the aspect that was most suitable to direct mathematical analysis.
Here’s the birthday analysis that Aki and I did:

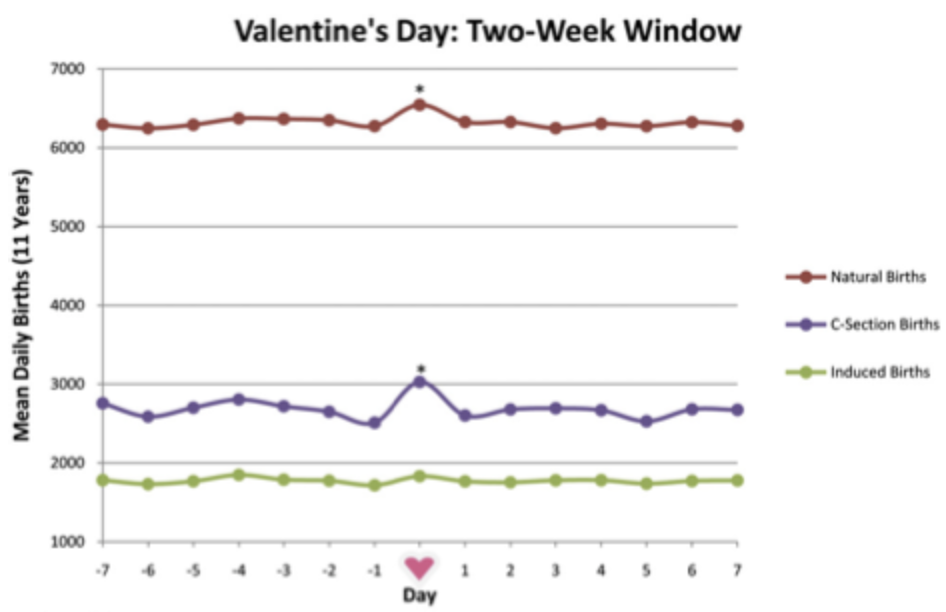
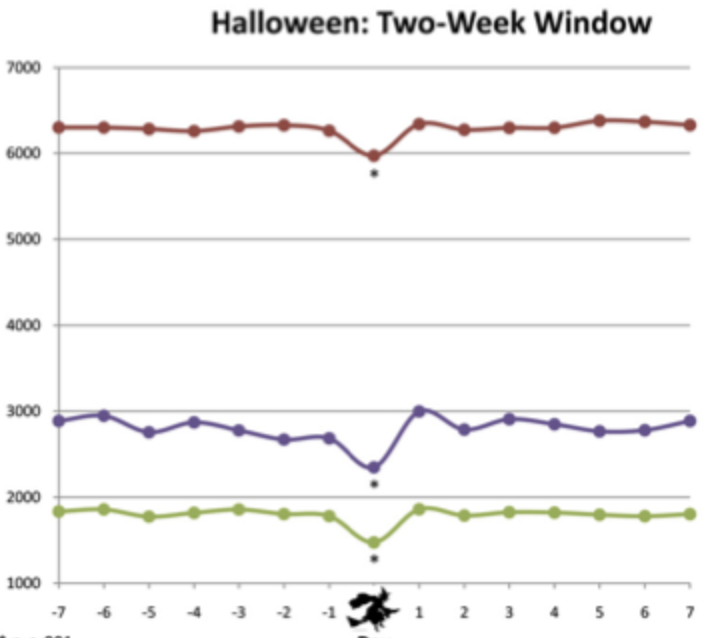
which is fine, but it’s all births, not just noninduced births. In my post, I pointed to a paper that separated the data by natural, C-section, and induced births but only had showed data for thirty days of the year:
The paper said the numbers came from the National Center for Health Statistics, but I wasn’t able to find data on births by date on their website, so I sent an email to the authors to see if they the counts for all three types of births for all 366 dates. No reply yet, unfortunately. (Fair enough; it’s a 15-year-old paper, and the authors may well have lost the data file.)
There was some discussion in comments on the effects of scheduled births on the pattern of dates of all three sorts of births. It’s tricky because whether a birth is scheduled or not is itself “endogenous” in that a birth could be scheduled but then the baby could be born before that date.
More data!
I wasn’t sure about what to say here in the absence of more data . . . and then some more data showed up! I did some searching and came across this article by Mireille Jacobson, Maria Kogelnik and Heather Royer on birth Timing and post-natal outcomes, who write:
Fewer births occur on major US holidays than would otherwise be expected. We use California data to study the nature and health implications of this birth date manipulation. . . . “missing” holiday births are displaced to a window of time 11 days before the holiday through 16 days after the holiday. Delivery type does not change over this window, consistent with a pure retiming of births rather than an increase in the use of procedures such as cesarean sections. . . . while some of the retiming seems to be driven by patients’ preferences, provider incentives appear to play a crucial role in holiday-related birth retiming. At Kaiser Permanente hospitals, where systemwide financial incentives discourage providers from electively timing births, the dip in births on holidays is less than for hospitals overall.
Here’s what they estimate:

No plots of the raw data, unfortunately just this estimate which is based on averaging over a set of holidays that occur throughout the year.
Here’s where the data come from:
Our primary data source is the restricted-access 2000-2016 California Birth Statistical Master Files. These data cover the universe of California births during this period and come from birth certificate information that the parents and medical provider fill out at the time of birth. These data include demographic information (e.g., age, education) for the parents, health conditions/outcomes of the mother and infant (e.g., gestational diabetes, birth weight, gestational length), and the use of medical interventions (e.g., cesarean section, induction, and stimulation). Crucial to our approach, these data include the exact date of birth of the infant.
And here’s a quick summary:
Births average 1442 per day, but are systematically lower on holidays and weekends (with a mean of about 1100 births per day) than on other days. The data on delivery mode make clear that this is a result of scheduling. The number of cesarean section deliveries is nearly 50% lower on holidays and weekends than on other days. Induced/stimulated births are about 28% lower. Spontaneous vaginal births are also lower on holidays (by about 15%), although they account for a much higher share of births on holidays (52%) than on other non-weekend days (44%).
That’s cool. Now I want to see the raw data. It says they’re in the California Birth Statistical Master Files. I don’t know where to find these files, also if they’re “restricted access,” maybe I don’t have permission to see them, and I guess that the authors of the above-linked paper won’t be able to send them to me.
A request
If anyone out there has the data from the California Birth Statistical Master Files and wants to plot the time series of avg #births by date (and multiply the number for 29 Feb by (# years in data)/(# leap years in data)), for each of the three categories of births, could you please graph these (three time series on a single plot would be fine) and send to me? Thanks!