How much of “Mississippi’s education miracle” is an artifact of selection bias?
Statistical Modeling, Causal Inference, and Social Science 2025-12-01
Howard Wainer, Irina Grabovsky, and Daniel Robinson write:
We were sceptical when we read Noah Spencer’s 2024 article about “Mississippi’s education miracle” which “>education economics expert Harry Anthony Patrinos called a “model for global literacy reform. The results Spencer reported from his econometric model do seem to be miraculous . . . Based on the National Assessment of Educational Progress (NAEP) fourth-grade literacy test scores, the state moved from a 49th place ranking in 2013 to the top 20 in 2023. The latest 2024 scores revealed that Mississippi is now tied for 8th place among 53 US states and territories!”
Such a dramatic turnaround clearly marks a sharp deviation from what we expect given the laws of nature/education generated by a century of empirical experience. If the turnaround is indeed legitimate, then the “intervention” that is claimed to be the cause of the improvement, the Literacy-Based Promotion Act (LBPA), which started in 2013, should be seriously considered for implementation in other states.
But now comes the bad news:
The improvement in the average performance of Mississippi’s fourth-graders on NAEP was preceded by two key changes in their schooling in third grade. One was the a priori sensible idea of trying to improve classroom instruction by improved teacher training, instituting preschool, and a variety of other helpful actions. This was to be accomplished through the promise of an additional annual state expenditure . . . about $111.63 of extra funding annually for each pupil. Comparing this amount to what are annual contemporary per pupil expenditures nationally, we have to agree that if such small expenditures can make a visible difference in student performance it truly is a miracle – a Mississippi version of St. John’s loaves and fishes.
But it was the second component of the Mississippi Miracle, a new retention policy, that is likely to be the key to their success.
Third-graders who fail to meet reading standards are forced to repeat the third grade. Prior to 2013, a higher percentage of third-graders moved on to the fourth grade and took the NAEP fourth-grade reading test. After 2013, only those students who did well enough in reading moved on to the fourth grade and took the test.
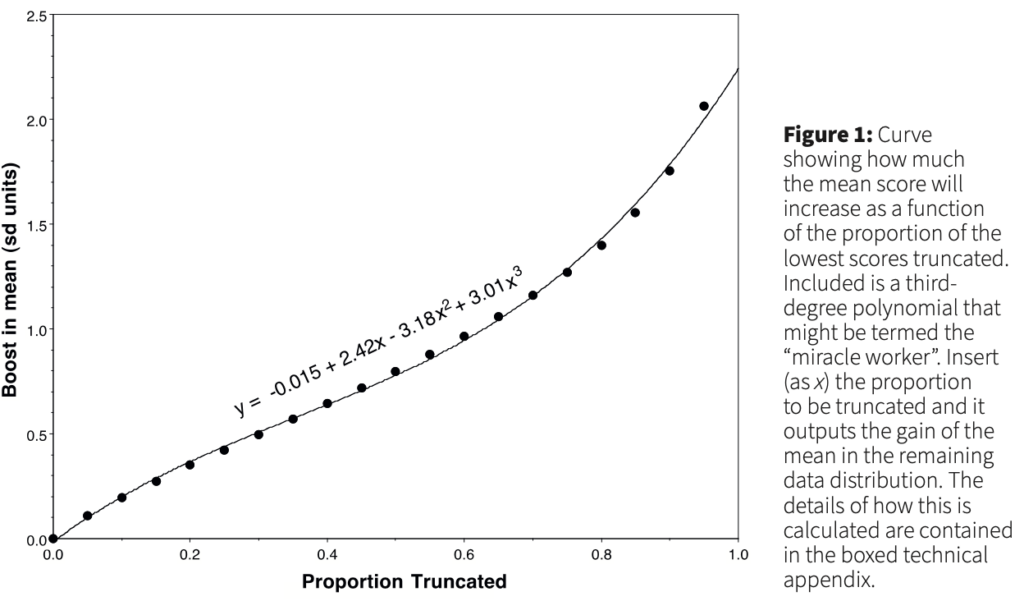
Wainer et al. share the figure at the top of this post to show how this works quantitatively, and then they continue:
As previously mentioned, the latest NAEP data for 2024 show even more impressive, “miraculous” results on the fourth-grade literacy test scores – a tie for 8th place. Strangely though, for the eighth-grade literacy test, the state’s rank dropped to a tie for 42nd place! This should clear up any miracle illusions that may remain. Need more proof that Mississippi public education is without miracles? The 2024 NAEP fourth-grade mathematics scores rank the state at a tie at 50th! The eighth-grade scores also qualify for 50th place.
OK, I wouldn’t use the word “proof” here, but I take their point.
There’s still some interesting stuff going on in the data, though. Wainer et al. share this figure:

and write:
Scores gradually increased for both from 1990 to 2015. But then the scores began to decline nationally whereas they continued to increase for Mississippi. Why? It is hard to credit Mississippi’s 2013 LBPA as the cause since there does not appear to be any change in Mississippi’s continued improvement. Yet viewed in the context of the national decline, perhaps LBPA deserves some credit. But if we are to credit LBPA for the continued growth, how do we apportion that credit to the Act’s two parts? Is it due to the changes in what was taking place in fourth-grade classrooms? Or who was allowed into those classrooms?
Good question! Here’s their answer:
The most credible way to do this is with a formal experiment in which we form four groups by crossing the two factors – extra per-pupil expenditures, and promotion based on reading performance – yielding four experimental groups . . . Unfortunately, in education, such experiments are rare . . . In the current situation, the best we can do is to use the model given in Figure 1 to predict the gain in mean score from the retention rates and see how much of Mississippi’s gains shown in Figure 2 are left unaccounted for. Were we to do this we would find that most of Mississippi’s gains are due to the retention rate.
Hey, don’t just say “most”! Give a percentage! And an uncertainty estimate!
It’s happened before
In their article, Wainer et al. also provide some historical context:
We have seen several previous K–12 education “miracles” that turned out to be hoaxes. Five of them were in Houston, Atlanta, the District of Columbia, El Paso, and New Orleans.
In the first four, investigators found fraud. The people in charge (e.g., superintendents) cheated to give the impression of increased test scores. In Houston, the numbers of students who were categorised as “special education” were increased so their low test scores would not be included in the school’s overall test scores. In Atlanta, records were falsified. In the District of Columbia, high-school students graduated who should not have. And in El Paso, to inflate scores, Mexican transfer students, who typically scored lower, were prevented from taking the state-mandated tenth-grade achievement tests.
The New Orleans miracle was caused by a natural disaster. Hurricane Katrina tragically relocated about a third of the students who came from the poorest areas. Removing thousands of low scorers immediately raised the average test scores of the students who remained . . .
OK, this seems pretty clear. So how did everybody get fooled?
Wainer et al. write:
There are three possible reasons. First, to his credit, Patrinos cited the 2024 study by Spencer whose analysis concluded that the LBPA was the cause of the increase in fourth-grade reading and maths scores. The gold standard for measuring the effects of causes is to . . . randomly assign students to either treatment . . . or control . . .
Spencer did not have the data required for such an analysis. So, instead, he improvised by using some prior years’ data as the control group, and instead of random assignment he used various bits of covariate information to equate this year’s students with the previous years.
This sort of approach often works–we generally recommend adjusting for pre-treatment variables in observational studies–but not here! Why not? Because, as Wainer et al. point out, “in the current year the bottom of the class was truncated and so were very much unlike the prior years’ scores – and no covariate adjustment was going to make them equal.”
They continue:
Besides weak empirical data, educational reformers like Patrinos should have given greater weight to the extant literature on the Mississippi Miracle. The miracle had already been convincingly debunked.
This last link is to a Los Angeles Times article entitled, “How Mississippi gamed its national reading test scores to produce ‘miracle’ gains,” written by Michael Hiltzik. Hey–I recognize that name! Palko sometimes links to him.
Wainer et al. conclude:
Third, Patrinos, and others who have praised the Mississippi miracle, should know that extreme educational reform success stories are non-existent. History has shown us that a little bit of digging has, in the past, always revealed such claims of miracles to be false. This does not mean that we should give up hope. Small successes are common in education. But dramatic huge successes should always alert us to scepticism.
Other views
I have not looked at these data myself, and I hold out the possibility that Wainer et al. are mistaken, that there are aspects of the situation they’ve not fully thought through, and that a more careful analysis would legitimately show something different. To get a sense of other perspectives, I googled *Mississippi miracle*.
The first item was a wikipedia page that went into the details of the Mississippi plan and report it as an unqualified success: “After adjusting for demographics, in 2024, Mississippi was the nation’s #1 state in Reading as well as in Mathematics.” But Wainer et al. say that Mississippi is tied for 50th in math. Can they really be worst in the nation, but best after demographic adjustment? I guess it’s possible.
Some of the wikipedia article seems to inadvertently support the skeptical position, as here:
Oklahoma, for instance, passed a bill in 2012 that mirrored the LBPA, only to pass a new law two years later that defanged the law. This was done to avoid actually holding back the students that could not read at grade level. Oklahoma’s scores have since plummeted and the state ranks near the very bottom of the NAEP’s list.
This seems consistent with the take that holding back the lowest-performing kids was the cause of the increase in average test scores.
I guess I could add a link to the Hiltzik article to the wikipedia page.
The next link is to an article in the New York Post entitled, “Mississippi’s reading triumph is no miracle — it’s the future of education,” again, 100% buying the effect with no comment on selection bias.
This is not to say that the policies being done in Mississippi are a bad idea! As Wainer et al. emphasize, small improvements matter too. It’s just not right to go around claiming large composite effects that are really due to selection on who takes the test, not improvements for individual kids.
The third link in my Google search is from a website called ExcelinEd entitled, “Four Reasons Why Mississippi’s Reading Gains Are Neither Myth Nor Miracle,” and beginning, “It’s time to debunk criticism of the Magnolia State’s literacy outcomes.” They address the selection issue head on:
This progress would not have been possible without ending social promotion and implementing the so-called “third-grade gate.” . . . Critics tend to take aim at retention for two reasons: First, it can be an emotional issue for families to find out their child needs to repeat a grade . . . Second, critics want to believe gains can be made without retention, and they strategically parse the data to prove their point.
Critics have alleged that Mississippi’s outcomes are a “statistical illusion,” because of the percentage of students retained by the third-grade gate. Retained students’ test scores aren’t part of the overall results, so they argue the picture is rosier than it should be.
But they think the improvement is real:
Except that’s not true at all. Researchers at Mississippi First took a deep dive into the data and what actually happened.
Here’s the short version: The largest NAEP gains in Mississippi were from 2013-2015 when no third graders were retained—because the state had not yet implemented that part of the law. The outcomes that led to the “Mississippi Miracle” designation in 2019 were made by the 2018 cohort of third graders, less than 5% of whom were retained.
There was a one-time jump in retention in 2019, because the state raised the standard for a student to pass the third-grade gate. But the retention rate has declined every year since then, even after the pandemic.
According to Wainer et al., the retention rate was 9.6% in 2018-19 and declined to 7.2% in 2022-23, and they argue that even a 7% retention rate would cause an improvement of 0.15 standard deviations from the selection effect alone. I don’t know how this maps onto test scores or state rankings, also the cumulative retention rate could be higher if some kids are also held back in earlier grades.
I’d never heard of ExcelinEd, so I clicked through to find out who they are. The board of directors is mostly a mix of Republican politicians and political appointees who served under Republican administrations. That’s fine–no reason that a partisan group shouldn’t care about education–, it just gives some sense of where they’re coming from.
In any case, similar arguments are made by nonpartisan sources. The ExcelinEd article points to this post on Chalkbeat, which is another site I’d never heard of before, but it doesn’t seem to have a partisan agenda. They seem to be doing their best to weigh the evidence:
Some have called it the “Mississippi miracle.” Others say not so fast.
In the last decade, Mississippi students have rapidly closed the test score gap with the nation as a whole, particularly in fourth grade. State officials, education wonks, and national journalists have attributed these improvements to the state’s 2013 early reading law, which included emphasizing phonics and holding back third graders who struggle to read. . . . “Mississippi has shown that it is possible to raise standards even in a state ranked dead last in the country in child poverty and hunger,” New York Times columnist Nick Kristof wrote in May. . . .
But a few commentators have pushed back on this rosy narrative. Los Angeles Times columnist Michael Hiltzik recently claimed scores had been “gamed.”
Chalkbeat says:
Hiltzik, the Los Angeles Times columnist, advanced two major critiques of the state’s test score gains in a recent column.
First, he argued that by holding back struggling third-graders, the state had inflated its test scores by removing those students from the pool of fourth grade test-takers.
In reality, this could help explain test scores jumps for a short period of time, but it doesn’t make much sense for longer-term gains. Eventually, students who are retained in early grades will move up to the next grade — they are not held back forever. Because Mississippi has seen sustained improvements, retention gaming appears to be an unlikely explanation. . . .
Andrew Ho, a testing expert at Harvard University and previously a member of the board that oversees NAEP, said his instinct is to question big test score gains. But in the case of Mississippi, he said, “I don’t see any smoking guns or red flags that make me say that they’re gaming NAEP.”
They bring up another issue:
One sometimes overlooked change in Mississippi education policy in the last decade involved not curriculum or instruction, but its testing regimen. In 2015, Mississippi overhauled its state test, including by aligning it more closely with NAEP. . . . Testing experts say that focusing on the content of a particular exam might improve scores because educators teach to that specific test. . . . “To the extent you prioritize NAEP, you risk inflating NAEP scores,” said Ho. However, the state testing shift began in 2015, while NAEP gains began in 2013. Additional scrutiny might shed more light on this issue.
So, lots to chew on.
The next Google link comes from PBS, an entirely uncritical report (sample quote, “The institute’s CEO, Kelly Butler, said she tells them there’s no secret to the strategy. ‘We know how to teach reading,’ she said. ‘We just have to do it everywhere.'”
Next, a straight-up press release from the state of Mississippi. Sample sentence: “The results speak for themselves.” No mention of selection bias.
Next is from a website called The74 (the name refers to “the education of America’s 74 million children”), “There Really Was a ‘Mississippi Miracle’ in Reading. States Should Learn From It.” They address the statistical concerns:
A research paper last fall from Noah Spencer from the University of Toronto found that the law helped drive the state’s gains.
Spencer estimated that the third-grade retention policy alone could be responsible for about one-quarter of the gains, and it was surely the most controversial element. Some people have even tried to cast doubt on Mississippi’s NAEP gains by arguing they’re merely a function of testing older kids. But this has been debunked: Mississippi does hold back more kids than other states, but it always has, and the average age of Mississippi’s NAEP test-takers has barely budged over time.
Research on third-grade retention policies has found that students who are retained tend to have better long-term outcomes than those who are not . . .
Lots of links there! Let’s look at some of them.
First, a negative take, from education analyst Diane Ravitch:
A long-time cellar dweller in the NAEP rankings, Mississippi students have risen faster than anyone since 2013, particularly for fourth graders. In fourth grade reading results, Mississippi boosted its ranking from forty-ninth in 2013 to twenty-ninth in 2019; in math, they zoomed from fiftieth to twenty-third. Adjusted for demographics, Mississippi now ranks near the top in fourth grade reading and math according to the Urban Institute’s America’s Gradebook report.
So how have they done it? Education commentators have pointed to several possible causes: roll-out of early literacy programs and professional development (Cowen & Forte), faithful implementation of Common Core standards (Petrilli), and focus on the “science of reading” (State Superintendent Carey Wright).
But one key part of Mississippi’s formula has gotten less coverage: holding back low-performing students. . . . a “third grade gate,” making success on the reading exit exam a requirement for fourth grade promotion. This isn’t a new idea . . . But Mississippi has taken the concept further than others, with a retention rate higher than any other state. In 2018–19, according to state department of education reports, 8 percent of all Mississippi K–3 students were held back (up from 6.6 percent the prior year). This implies that over the four grades, as many as 32 percent of all Mississippi students are held back; a more reasonable estimate is closer to 20 to 25 percent, allowing for some to be held back twice.
I don’t quite follow this: are they just holding back 8% of third graders, or are they holding back 8% each year?
Next, a positive take, from Todd Collins, writing at the site of the charter school organization, the Fordham Insitute:
Mississippi didn’t cheat. Its reading gains are real. . . . the data show that it’s done so for at least twenty years, and at the same rates as under the current literacy law.
Retention by itself did nothing for them, mechanically or otherwise. Before 2013, Mississippi ranked forty-eighth for fourth grade reading, despite having one of the country’s highest retention rates. And after the reading retention law went into effect, the year-to-year rate changes had no discernible effect on NAEP results. . . .
Moreover, the pandemic provided a clear natural experiment: What happens when retention stops? In 2021, Mississippi suspended its third grade retention requirement. When those students took the fourth grade NAEP in 2022, the “statistical illusion” should have worked in reverse, sending Mississippi scores tumbling, relative to other states. Instead, although scores did fall, as they did in forty-four other states, Mississippi’s drop was less than the national average.
There’s also the Patrinos article mentioned near the top of this post, but it’s just terrible, as it doesn’t even acknowledge the selection issue at all, it’s just straight-up hype. Similarly, economics journalist Noah Smith writes, “Mississippi has had a big breakthrough in teaching poor kids to read! The core of the approach is an old technique called “phonics” that’s coming back into vogue. But it’s also about identifying students who are struggling and giving them extra resources, while also not simply giving them a rubber stamp and letting them pass to a higher grade.” Sure, but if you don’t let them pass to a higher grade, you’re gonna see higher average scores among the students who do take the test. This is something that an economics journalist should realize!
Finally, here’s a report from Mississippi First, “a leading voice for high-quality early education, high-quality public charter schools.” They’re an interested party here, but they’re also close to the data and have a motivation to get things right, so we should look at what they have to say:
On the 4th grade reading test, Mississippi gained 20 scale points between 1992, when the first state NAEP data were released, and 2019, when we first reached the national average. . . . Mississippi had two periods of big gains: 2005-2009 and 2013-2019 . . .
On the 4th grade math assessment, we gained 18 points from 2003 to 2019. Mississippi’s math gains were very steady in this 16-year period, with the state improving little by little while the nation stood still, until we finally saw Mississippi’s gap-closing jump between 2017 and 2019.
Mississippi’s Literacy-Based Promotion Act (LBPA) did not pass until spring 2013 and the “gate” (i.e., the requirement that students score a minimum level of proficiency, which originally was a level 2 of 5) did not go into effect for 3rd graders until 2015. This means the first year that Mississippi kids who experienced the “gate” were in the NAEP sample was 2017, when 15 points of our 20-point gain had already happened. . . . the LBPA can only explain 4th grade gains beginning in 2017.
What is the “Bottom 10%” Argument, and Why Is It Unpersuasive? . . .
The LA Times column claims that Mississippi’s NAEP success–specifically our reaching the national average in 4th grade reading–is a sham based on the analysis of a blogger armed with a graph of NAEP 4th grade reading data between 2013 and 2022 and the claim that Mississippi had a “nearly 10%” retention rate in 3rd grade following the LBPA’s passage. . . . but the percentage of 3rd graders held back as a result of the LBPA in whole or in part has never been that high. Certainly, the LBPA caused an increase of between 5.74-5.91 percentage points in the retention rate over a base trend of around 3-3.4% in the years immediately prior to the 2014-2015 implementation, but after that first year, the retention rate began to drop back down to pre-LBPA levels. By 2017-2018, the retention rate as a result of the LBPA was no higher than 1.58%, and the overall rate was less than 5%. . . . Because the LBPA caused so few retentions by 2018, Mississippi actually raised the bar in 2018-2019 so that “passing” the gate meant a higher level of proficiency in reading (now a 3 of 5, instead of a 2 of 5). After that, the overall retention rate did reach a high of 9.6% for the 2019 3rd grade cohort (2020’s 4th grade cohort), but those kids weren’t in the 2019 or 2022 4th grade NAEP. . . .
I [Rachel Canter from Mississippi First] object to the whole construct of the bottom 10% methodology because retained students don’t just disappear such that one needs to “add them back in.” They actually eventually get promoted, which means they do show up in 4th grade data, including 4th grade NAEP, just after some remediation (hopefully!). Having better scores after being held back . . . is that not the point of grade retention?


So where are we, then?
I’m not sure what to think. On one hand, Wainer, Grabovsky, and Robinson are experts on educational measurement, their argument about selection effects is persuasive, and their meta-argument about skepticism given the history of education hype also makes sense to me. Also, Howard’s a friend, and he’s a reasonable person, so I’m inclined to agree with him.
On the other hand, it all depends on the numbers: how many kids of each grade are held back each year, how they do in later years, etc. And it seems likely that some of these numbers will never be available.
Another question is, what are the causal inferences we’re looking for? How would we summarize things if we had all the data, including all potential outcomes? We’d like to know the changes due to the program among kids who would not be held back in any case, kids who would be held back in any case, and kids who would be held back under the treatment but not under the control. Among those in that third group, there’s the question of whether you’re comparing later outcomes in the same year (i.e., the same age of the kid) or at the same grade (so that you’re comparing the test scores of held-back kids to the scores they would have receive a year earlier had they been promoted). There’s also the frustrating way in which the discussions jump back and forth between absolute test scores and demographically-adjusted comparisons between states.
Another challenge in sorting this all out is that the Mississippi program had a lot of features, and Mississippi’s test scores had been improving for awhile. Some of the “Mississippi miracle” discussions focus on what’s happened since 2013, but the article from Mississippi First seems to be arguing that state policies have been helping since 1992. So it’s kind of a moving target. There’s also the association with phonics-based language instruction and a kind of general take that Mississippi’s success comes from them holding kids to a more rigorous standard. Which could be, but there I lean toward the skepticism of Wainer et al., in that states always seem to be talking about getting back to basics in education.
So, lots of moving parts. On statistical grounds, it would seem undeniable that some large chunk of the improved test scores in Mississippi come from the selection effect of delaying the students who were going to perform the worst, but it seems hard to put a number on this. In any case, it’s just gonna be hard to make causal attributions and estimate causal effects in a context where the national outcomes are changing so much, as can be seen in the second graph near the top of this post.
Wainer’s reactions
I sent the above to Howard Wainer, the first author of the above-linked paper that questions the claims of Mississippi’s success, and here’s how he responded:
OK — let’s take it from the top.
The basic idea is that they (Mississippi) picked out an outcome variable to measure success (NAEP score). Then they instituted a compound treatment (funding, class size, etc + retention ON THE BASIS OF THE OUTCOME VARIABLE) and the goal was the measure the causal effect of each of the components of the treatment (e.g. how much is due to class size and how much is due to focused retention). This is tough going under any circumstance, but especially without a control group. Hence my earlier comment to you about Hugo Muench’s “laws” of clinical studies, which essentially says that nothing improves the performance of an innovation more than lack of controls.
Anyway, this means that trying to figure out what is the causal effect of each part is tough and so our guess that it was mostly the newly focused retention policy we thought was a good bet. Which is why we included the plot of mean gains as a function of truncation percent to indicate that it accounted for (order of magnitude) most (all?) of the gains claimed. Yes, they had a high retention rate previously, but who was retained was based on a mixture (unknown, at least to us) of variables/causes. The new policy retained specifically on the basis of the outcome variable.
Thus we would posit that the retention rate is unlikely to have much of an effect on the height of 4th graders, but it would if only short kids were retained.
But, there is a lot of dark here, and we tried to offer the most plausible explanation all things considered. We were not inclined to give Mississippi the benefit of the doubt (based on the chicanery that has manifested itself with essentially ALL prior education miracles.
Fair enough. I still wonder what happens with those kids who are held back and are then tested a year later. I guess they improve on average a lot on their own, no matter what is done, during that year.
Also, I’m not sure what’s the ultimate policy goal: maybe to improve reading and math ability (as measured by test scores) when kids leave the K-12 system? I think this would be one of the traditional reasons to hold students back a grade, so that they have a longer time to learn the material, which could be helpful even if the treatment is having no effect on their learning trajectories.
Another way of putting this is that I don’t think it’s always clear what people are estimated here. The causal effect of the treatment would apply to individual students, but the outcomes are being compared in the aggregate, which is a challenge given that the treatment affects who’s being aggregated.