Survey Statistics: structured MRP to smooth survey weights
Statistical Modeling, Causal Inference, and Social Science 2026-08-04
Last week, Raphael K shared a concern: adjusting for lots of variables can lead to very large weights. So today let’s dive into Si et al. 2020, who saw this in constructing survey weights for the NYC Longitudinal Study of Wellbeing.
To adjust for lots of variables, Si et al. 2020 turned to MRP (Multilevel Regression and Poststratification) and equivalent weights based on these models (see “struggles with equivalent weights”, continued struggles, and “equivalent models, equivalent weights (locally)”).

In a simulation study they compare:
- Ind-P: MRP with commonly-used Independent Normal priors
- Str-P: MRP with a structured prior, see below.
- Ind-W: equivalent weights version of Ind-P
- Str-W: equivalent weights version of Str-P
- Rake-W: classical raking weights, a type of calibrated weights
- PS-W: classical poststratification weights, another type of calibrated weights
- IP-W: inverse probability of selection weights
They cover the “3 flavors of survey weights”: equivalent weights, calibrated weights, IP-W.
I won’t bury the lead, they found MRP performed best, then equivalent weights, then classical weights (calibrated or IP-W). See their Figure 4.1 for the simulation scenario without terribly many empty poststratification cells:

With many empty poststratification cells, Str-P outperforms Ind-P. (They don’t redo Figure 4.1 for this scenario, which confused me a bit.) So what is this structure that helps ?
In “improving with structure” we saw that Gao et al. 2021 found it helpful to use the ordinal structure of variables like age. Si et al. 2020 use the interaction structure:
We induce structured prior distributions to be able to handle deep interactions and account for their hierarchy structure, where the high-order interaction terms will be excluded if one of the corresponding main effects is not selected.
I asked about sparse priors for MRP back in “Sparsified MRP”. I didn’t remember that Si et al. 2020 had worked on this ! Ok so they write their structure more generally but I find it easier to read with a specific example. Consider just 2 variables from their motivating NYC Longitudinal Study of Wellbeing: age (5 categories) and race (5 categories). Here’s how their Ind-P prior differs from the Str-P:
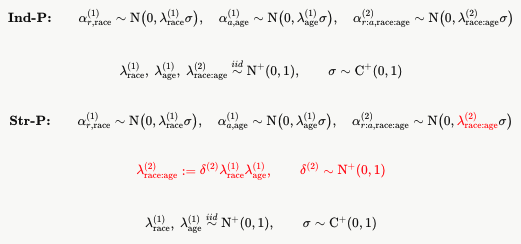
(I had Claude type up my hand-drawn notes, though I still share Brendan Leonard’s preference for hand-drawn materials.)
Si et al. 2020 say these are similar to the Horseshoe prior. It differs in two ways, I think ? First, Si et al. 2020 have the selection at the batch level (e.g. age or race). The usual Horseshoe would have local scale lambdas for each age and race category. Second, the usual Horseshoe would use a half-Cauchy rather than half-Normal prior on these local scales.

Ok let’s get back to the original concern: adjusting for lots of variables can lead to very large weights. Si et al. 2020 show in Figure 5.1 that the equivalent weights based on this structured prior model look much less variable than calibration weights (I don’t see the IP-W weights in the figure itself): 