Extracting Information From Objects Using Names()
R-bloggers 2013-03-17
(This article was first published on R for Public Health, and kindly contributed to R-bloggers)
One of the big differences between a language like Stata compared to R is the ability in R to handle many different types of objects at once, and combine them together or pull them apart. I had a post about objects last year, but I thought I'd show in this post how to extract information from objects you create in R. For this example, I'll go back to a dataset I've used in the past called mydata.Rdata and it's in the Code and Data Download site. One function that is extremely useful to know is names(). The names() function will show you everything that is stored in R under that object name. So, for example, if you do 

mydata.subset<-mydata[,c(1:2)]
names(mydata)[4]<-"Weight_lbs"
 Ok, so now we'll see how the names() function can be used in other applications. 1. Summary objects There are two ways to extract information from objects in R, using subsetting and using the "$" operator. Below, we summarize the Age vector and store the results in sum.vec. We print out the sum.vec object and the print out the corresponding names. Now we can extract the 1st element of the summary vector of Age in the following way using the [ ] operator.
sum.vec[c(2,3,5)]


So we see that saved under the reg.object are the coefficients, the residuals, fitted values, degrees of freedom, and a lot more. To find out everything that names() provides for a given object, look it up by doing ?lm. Now, to extract any of these components, like the residuals, use the "$" operator like this:
reg.object$residuals
You can make use of this extraction by taking the mean of the residuals

hist(reg.object$residuals, main="Distribution of Residuals" ,xlab="Residuals")

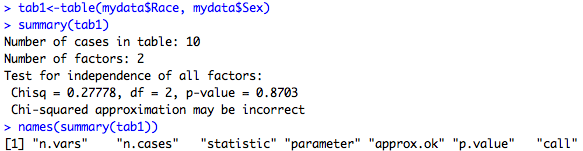
Don't forget that you can summarize regression objects using summary(), and get the names() of that summary too, like this:
which will give you more objects you can extract from your regression. You can use the names() function on any statistical model or function such as aov(), t.test(), chisq.test(), etc. 3. Histograms and boxplots Finally, let's go back to that histogram and save that into an object. There are objects under names() of the histogram object now: 
 Here I've extracted the stats object which gives you the lower whisker, the lower hinge, the median, the upper hinge, and the upper whisker for each group, which you can see below.
To leave a comment for the author, please follow the link and comment on his blog: R for Public Health.
R-bloggers.com offers daily e-mail updates about R news and tutorials on topics such as: visualization (ggplot2, Boxplots, maps, animation), programming (RStudio, Sweave, LaTeX, SQL, Eclipse, git, hadoop, Web Scraping) statistics (regression, PCA, time series,ecdf, trading) and more...