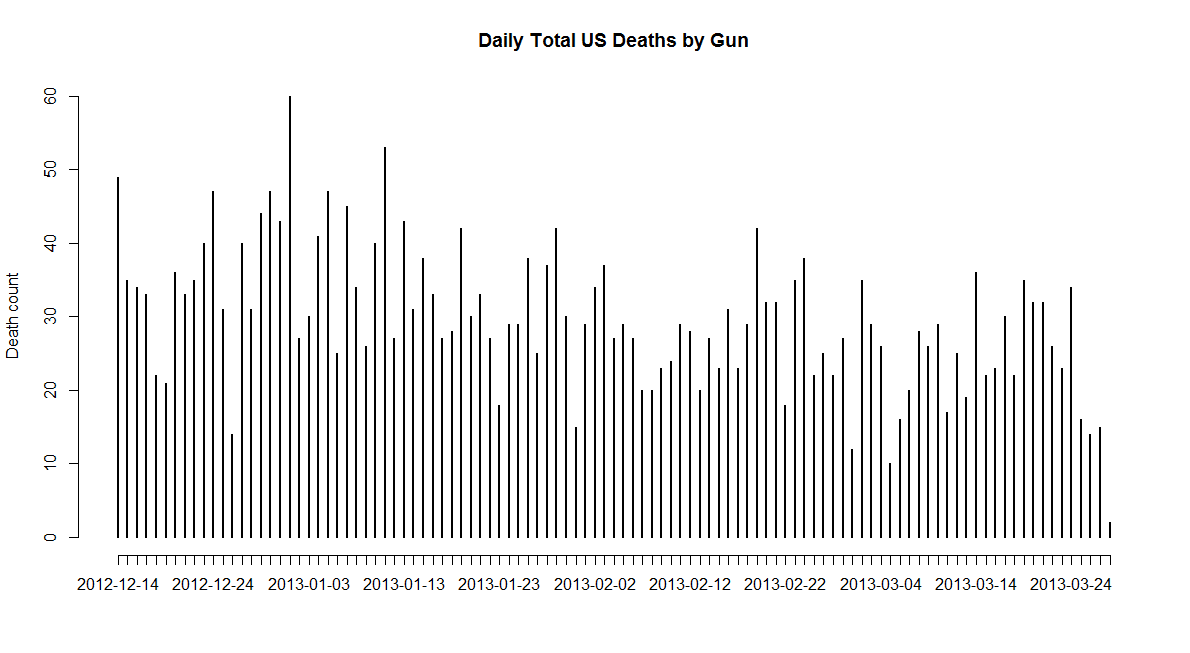
Generate GIS integrated animation:Gun deaths animation – R
R-bloggers 2013-03-29
(This article was first published on Econometrics by Simulation, and kindly contributed to R-bloggers)
# I wanted to briefly revisit a previous post in order to update the graphics. 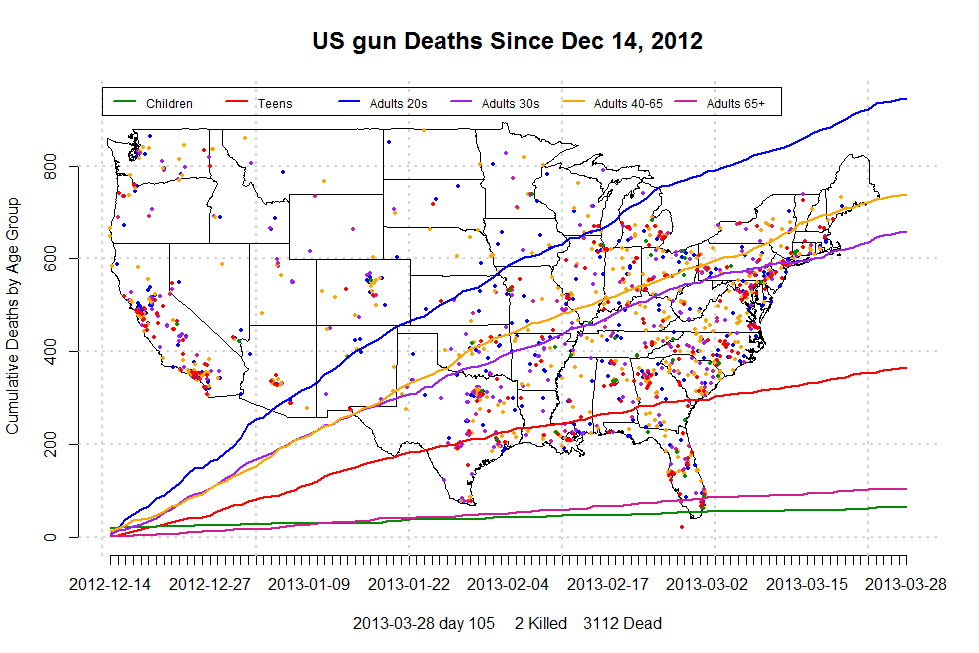
To leave a comment for the author, please follow the link and comment on his blog: Econometrics by Simulation.
R-bloggers.com offers daily e-mail updates about R news and tutorials on topics such as: visualization (ggplot2, Boxplots, maps, animation), programming (RStudio, Sweave, LaTeX, SQL, Eclipse, git, hadoop, Web Scraping) statistics (regression, PCA, time series,ecdf, trading) and more...