Subtraction Is Crazy
R-bloggers 2013-04-05
I was re-reading Michael Murray’s explanation of cointegration:
and marvelling at calculus.
Calculus blows my mind sometimes. Like, hey guess how much we can do with subtraction.
— protëa(@isomorphisms) March 28, 2013
Of course it’s not any subtraction. It’s subtracting a function from a shifted version of itself. Still doesn’t sound like a universal revolution.
(But of course the observation that the lagged first-difference will be zero around an extremum (turning point), along with analytic methods of calculating the (infinitesimal) first-differences of a function, made a pretty big splash.)
Jeff Ryan wrote some R functions that make it very easy to first-difference financial time series.
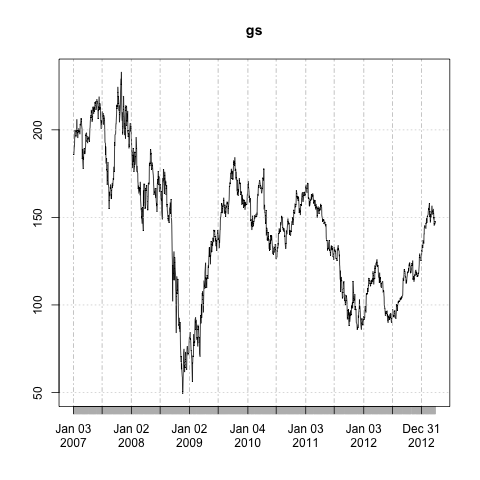
Here’s how to do the first differences of Goldman Sachs’ share price:
require(quantmod)getSymbols("GS")gs <- Ad(GS)plot( gs - lag(gs) )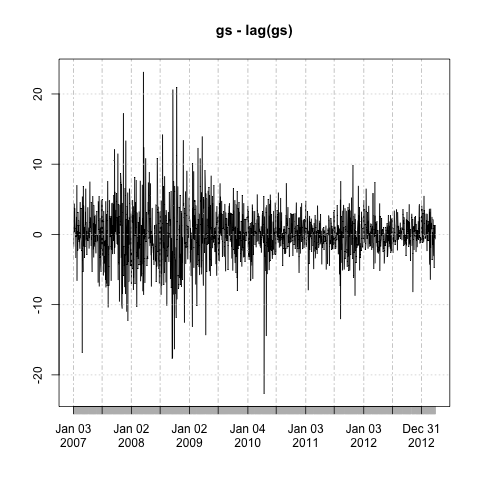
Look how much more structured the result is! Now all of the numbers are within a fairly narrow band. With length(gs) I found 1570 observations. Here are 1570 random normals plot(rnorm(1570, sd=10), type="l") for comparison:

Not perfectly similar, but very close!
Looking at the first differences compared to a Gaussian is also a nifty way to show what’s different between public equity markets and a random walk. What most obviously sticks out to me is the vol going up periodically in the $GS time series.
I think I got even a little closer with drawing the stdev’s from a Poisson process plot(rnorm(1570, sd=rpois(1570, lambda=5)), type="l")

but I’ll end there with the graphical futzing.
What’s really amazing to me is how much difference a subtraction makes.
R-bloggers.com offers daily e-mail updates about R news and tutorials on topics such as: visualization (ggplot2, Boxplots, maps, animation), programming (RStudio, Sweave, LaTeX, SQL, Eclipse, git, hadoop, Web Scraping) statistics (regression, PCA, time series,ecdf, trading) and more...