A Call for Context-Aware Measurement
R-bloggers 2013-04-25
(This article was first published on Engaging Market Research, and kindly contributed to R-bloggers)
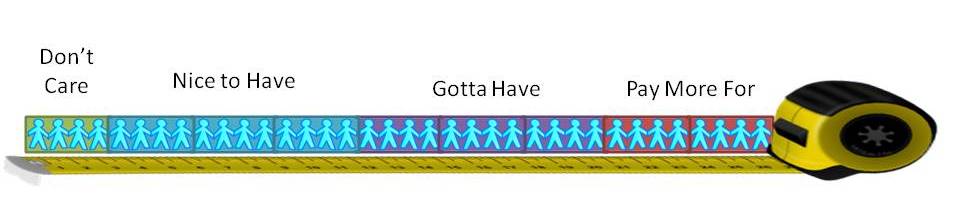
Context awareness seems to be everywhere, and everyone seems to be saying that context matters. Gartner foresees "a game-changing opportunity" in what it calls context-aware computing. The title of their report states it best, "Context Shapes Demand at Moments of Truth." Their reasoning is straightforward. They assume that what you want (your preferences) are dependent on the consumption context. Once they know your context (e.g., from your mobile devices or on-site surveillance), they can feed you information, advertising, promotions and anything else that would help sell their products or services. This is another sign of the growing acceptance that context plays a determinant role in consumer decision making. If who, what, where, when and why are so important, how do we explain context-free measurement in marketing research? For example, "What Do Customers Really Want?" is a Harvard Business Review article outlining "best practices" for the measurement of preference. According to these Bain and Company researchers, rating scales are "blunt instruments" unable to distinguish between "nice to have" and "gotta have." Thus, instead of rating scales, customers are asked to make a series of trade-off among different sets of four restaurant attributes, such as: - Food served hot and on time,
- New specials weekly,
- Healthful menu options, and
- Portions are just right.
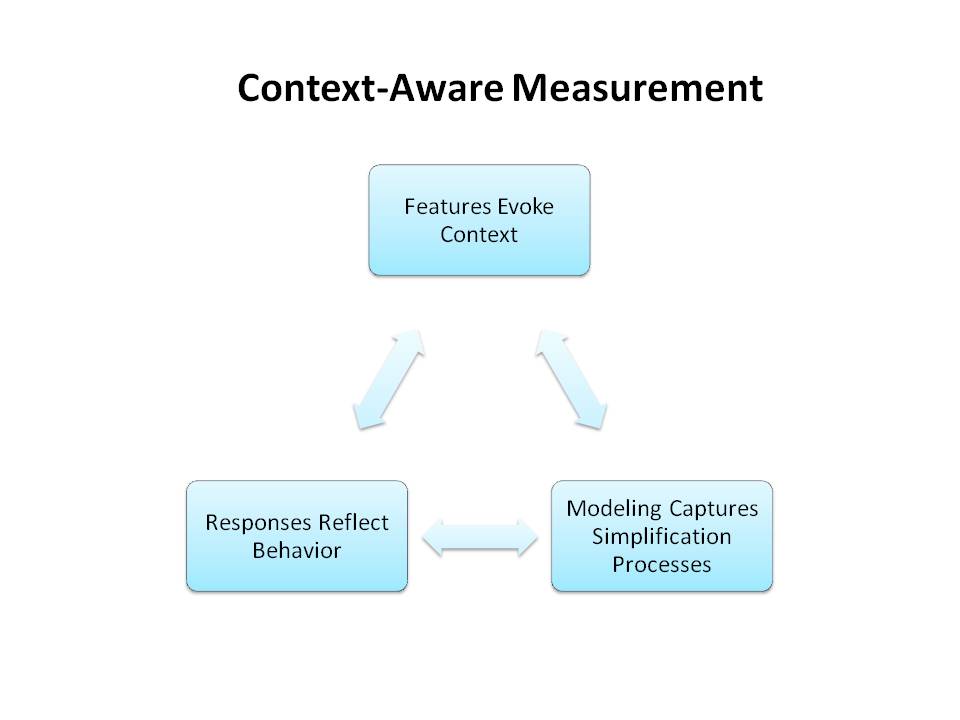
Two Forces at Work Creating a Single Evaluative Dimension Now, we are ready to search for underlying structure. Our goal is learning what customers really want, and we already know a great deal from observing successful offerings in the marketplace. Products and services evolve over time to satisfy customer demands. Customers learn what they want as they consume what is available. This is a simultaneous evolution as brands improve their offerings to better satisfy their customers' demands that are changing at the same time in response to product improvements. When an equilibrium is reached, we have a relatively stable configuration taking the form of an underlying continuum of product and services ranging from the basics that most want to the high-end that fewer and fewer customers seek. This is a shared understanding between providers and consumers. It is communicated by brand messaging and repeated in the press and through word of mouth. As consumers become familiar with the product categories (e.g., fast food, casual dining, fine restaurants, buffets, pubs, cafes, diners, drive-ins and dives), they learn about this product and service continuum and determine where they fall along this dimension. That is, consumers learn what is available and decide how much they want given what is available. I have used the phrase "decide how much they want" because providers have deliberately configured their product and service offerings so that there is always a continuum from basic to premium (good, better, best). A basic product with only those features and services defining the product category is offered at the lowest price to appeal to the low-end user. Additional features are included at some cost in a cumulative fashion to attract the more demanding users. Finally, you will find the premium offering targeting the highest end of the market. If we are careful when we specify the restaurant type and the eating occasion, we can anticipate uncovering a single continuum along which all the contextualized features and services can be arrayed. Obviously, consumers are looking for different benefits when they go to an all-you-can-eat buffet rather than an upscale restaurant. However, is restaurant type alone sufficient to yield a single dimension? For instance, does everyone who decides to go to an all-you-can-eat buffet looking for the about the same features and services? Can I array all the contextualized features and services along a single dimension in terms of their pull or attraction? The answer is no if customers are looking for different products and services when they visit the buffet for lunch rather than dinner? The answer is also no when older patrons are seeking different benefits (the rationale for early bird specials). Our first test might be to assess the fit of the graded response model. The graded response model (grm) is one of many models from item response theory covered by the R package ltm. It is used with ordinal scales such as the behavioral anchors tapping pull or attraction. The assumption is that respondents possess different levels of the underlying trait being measured by the items. In this case the items are descriptions of contextualized products and services. Thus, respondents differ in how much they want or demand with some seeking only basic products and services and others desiring much more than the basics. The score that an individual assigns to a specific item depends on the relationship between the individual's demand level and the item's location on the same scale. Each item will have its own set of thresholds. Basic products and services that everyone expects to be delivered will receive higher ratings from everyone but only the highest ratings from the more demanding. On the other hand, those products and services that only the most demanding expect or want will be rated higher only by individuals demanding more. The R package lordif (logistic ordinal differential item functioning) provides the test and identifies individual items that function differently for different groups of respondents. We are not testing whether different groups are more or less demanding. Mean level differences are not a problem. Differential item functioning occurs when the item parameters have different values for different groups after controlling for latent demand. For example, if the lunch crowd was just less demanding, we would not have differential item functioning since all the ratings would be lower. It is only when lunch and dinner customers want different things that we are forced to separate the two groups. Differential item functioning will check if time of day (lunch, early bird, dinner) or other observed variables matter. We stop once we find a single dimension with ordinal responses explained by the graded response model. Exploiting the Single Dimension from Market Structure and Consumer Simplification Strategies It is not difficult to imagine having to ask many contextualized product and service items. As an example, if we think about convenience of a fast food restaurant, it is easy to generate a long list of questions that make fast food quick and easy: location relative to home or work, ease of entry/exit, drive-thru, parking, wait to order, easy of ordering, wait for food preparation, payment alternatives and time, difficulty eating there or in your car, and many more at increasing levels of specificity. Although this level of detail is needed if remedial actions are to be taken based on the data collected, we are reluctant to ask each respondent to complete such a long list of ratings. Obviously, fatigue and completion rates are concerns. In addition, long rating batteries tend to create their own "microclimates" and limit the generalizability of the findings. In my previous post, Reducing Respondent Burden: Item Sampling, I demonstrated how the ltm R package can be used when one has "planned missing data." I can estimate a respondent's value on the underlying latent trait using only a subset of all the items. The items that each respondent is asked to rate can be a random sample (item sampling) or chosen sequentially based on previous responses (computerized adaptive testing). In the previous post, it was shown how the grm() function in the ltm package provides both detailed diagnostic information about all the items and accurate estimates of individual respondent's latent traits even when only half of the items have been randomly sampled. We have taken advantage of the constraints imposed by the marketplace to identify a single underlying preference scale along which both consumers and the products/services they want can be aligned. Our client now knows which actions will give them a competitive edge and which will yield additional revenues. Moreover, we have learned the location of all the respondents along the same continuum. We can use this latent trait as we would any other individual difference measure, for example, we can track changes over time or enter it as a variable in a regression equation.
To leave a comment for the author, please follow the link and comment on his blog: Engaging Market Research.
R-bloggers.com offers daily e-mail updates about R news and tutorials on topics such as: visualization (ggplot2, Boxplots, maps, animation), programming (RStudio, Sweave, LaTeX, SQL, Eclipse, git, hadoop, Web Scraping) statistics (regression, PCA, time series,ecdf, trading) and more...