Top 100 R packages for 2013 (Jan-May)!
R-bloggers 2013-06-13
What are the top 100 (most downloaded) R packages in 2013? Thanks to the recent release of RStudio of their “0-cloud” CRAN log files, we can now answer this question (at least for the months of Jan till May)!
By relying on the nice code that Felix Schonbrodt recently wrote for tracking packages downloads, I have updated my installr R package with functions that enables the user to easily download and visualize the popularity of R packages over time. In this post I will share some nice plots and quick insights that can be made from this great data. The code for this analysis is given at the end of this post.
Top 8 most downloaded R packages – downloads over time
Let’s first have a look at the number of downloads per day for these 5 months, of the top 8 most downloaded packages (click the image for a larger version):
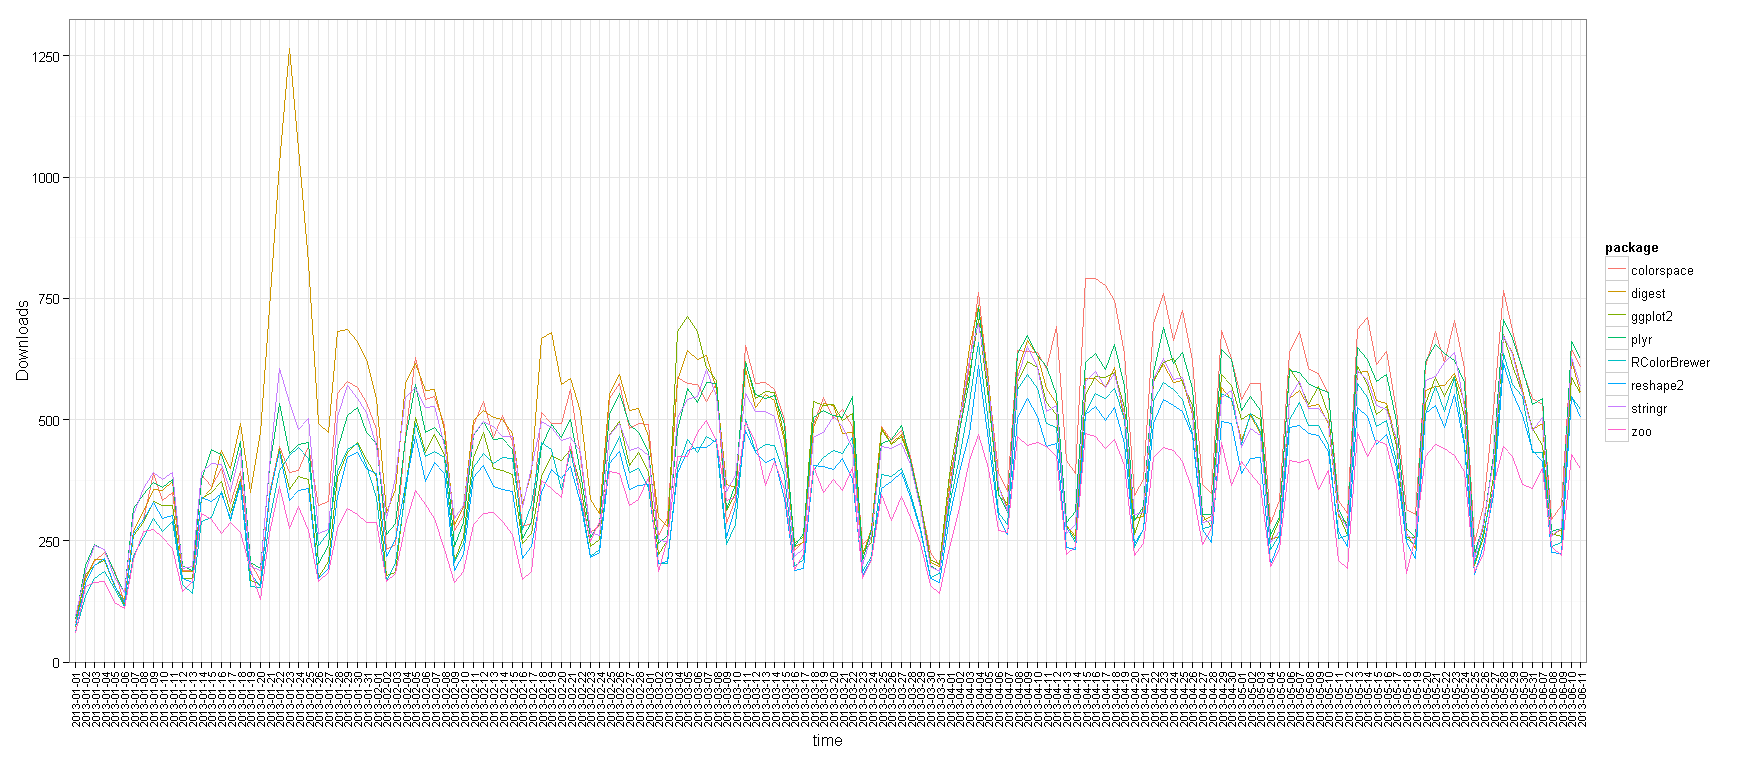
We can see the strong weekly seasonality of the downloads, with Saturday and Sunday having much fewer downloads than other days. This is not surprising since we know that the countries which uses R the most have these days as rest days (see James Cheshire’s world map of R users). It is also interesting to note how some packages had exceptional peaks on some dates. For example, I wonder what happened on January 23rd 2013 that the digest package suddenly got so many downloads, or that colorspace started getting more downloads from April 15th 2013.
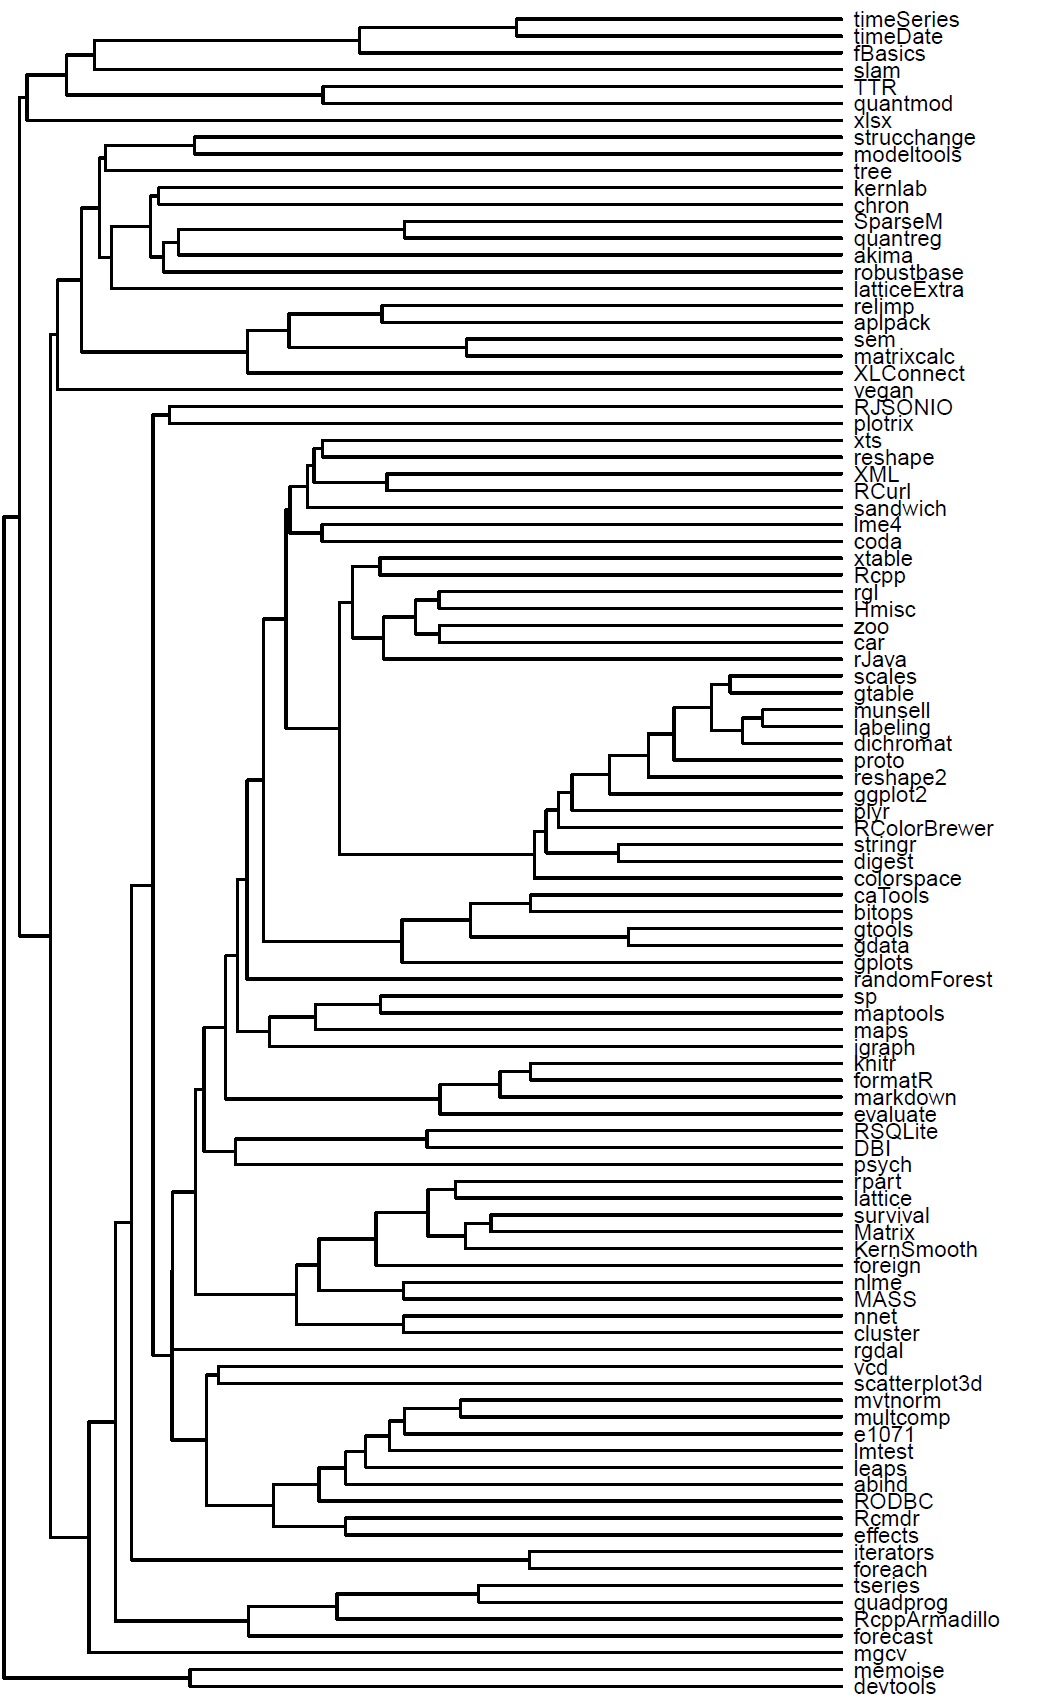
“Family tree” of the top 100 most downloaded R packages
We can extract from this data the top 100 most downloaded R packages. Moreover, we can create a matrix showing for each package which of our unique ids (censored IP addresses), has downloaded which package. Using this indicator matrix, we can thing of the “similarity” (or distance) between each two packages, and based on that we can create a hierarchical clustering of the packages – showing which packages “goes along” with one another.
With this analysis, you can locate package on the list which you often use, and then see which other packages are “related” to that package. If you don’t know that package – consider having a look at it – since other R users are clearly finding the two packages to be “of use”.
Such analysis can (and should!) be extended. For example, we can imagine creating a “suggest a package” feature based on this data, utilizing the package which you use, the OS that you use, and other parameters. But such coding is beyond the scope of this post.
Here is the “family tree” (dendrogram) of related packages:
To make it easier to navigate, here is a table with links to the top 100 R packages, and their links:
PackageTitleDownloads1 plyr Tools for splitting, applying and combining data840492 digest Create cryptographic hash digests of R objects831923 ggplot2 An implementation of the Grammar of Graphics827684 colorspace Color Space Manipulation819015 stringr Make it easier to work with strings776586 RColorBrewer ColorBrewer palettes667837 reshape2 Flexibly reshape data: a reboot of the reshape package649118 zoo S3 Infrastructure for Regular and Irregular Time Series (Z’s ordered observations)608449 proto Prototype object-based programming5904310 scales Scale functions for graphics5836911 car Companion to Applied Regression5745312 dichromat Color Schemes for Dichromats5662413 gtable Arrange grobs in tables5443114 munsell Munsell colour system5318315 labeling Axis Labeling5187716 Hmisc Harrell Miscellaneous4783617 rJava Low-level R to Java interface4773118 mvtnorm Multivariate Normal and t Distributions4688419 bitops Bitwise Operations4568920 rgl 3D visualization device system (OpenGL)4100121 foreign Read Data Stored by Minitab, S, SAS, SPSS, Stata, Systat, dBase, ..3784922 XML Tools for parsing and generating XML within R and S-Plus3715323 lattice Lattice Graphics3659724 e1071 Misc Functions of the Department of Statistics (e1071), TU Wien3518025 gtools Various R programming tools3502826 sp classes and methods for spatial data3478627 gdata Various R programming tools for data manipulation3426228 Rcpp Seamless R and C++ Integration3392929 MASS Support Functions and Datasets for Venables and Ripley’s MASS3366730 Matrix Sparse and Dense Matrix Classes and Methods3074031 lmtest Testing Linear Regression Models3031932 survival Survival Analysis3018633 caTools Tools: moving window statistics, GIF, Base64, ROC AUC, etc2994534 multcomp Simultaneous Inference in General Parametric Models2987135 RCurl General network (HTTP/FTP/…) client interface for R2886636 knitr A general-purpose package for dynamic report generation in R2810437 xtable Export tables to LaTeX or HTML2809138 xts eXtensible Time Series2805839 rpart Recursive Partitioning2781240 evaluate Parsing and evaluation tools that provide more details than the default2761741 RODBC ODBC Database Access2613142 quadprog Functions to solve Quadratic Programming Problems2543343 tseries Time series analysis and computational finance2514444 DBI R Database Interface2479345 nlme Linear and Nonlinear Mixed Effects Models2436046 lme4 Linear mixed-effects models using S4 classes2419947 reshape Flexibly reshape data2411848 sandwich Robust Covariance Matrix Estimators2401649 leaps regression subset selection2366650 gplots Various R programming tools for plotting data2325151 abind Combine multi-dimensional arrays2275852 randomForest Breiman and Cutler’s random forests for classification and regression2240153 Rcmdr R Commander2213154 coda Output analysis and diagnostics for MCMC2190055 maps Draw Geographical Maps2155056 igraph Network analysis and visualization2142357 formatR Format R Code Automatically2104958 maptools Tools for reading and handling spatial objects2095759 RSQLite SQLite interface for R1967160 psych Procedures for Psychological, Psychometric, and Personality Research1954561 KernSmooth Functions for kernel smoothing for Wand & Jones (1995)1916662 rgdal Bindings for the Geospatial Data Abstraction Library1906463 RcppArmadillo Rcpp integration for Armadillo templated linear algebra library1889964 effects Effect Displays for Linear, Generalized Linear, Multinomial-Logit, Proportional-Odds Logit Models and Mixed-Effects Models1884365 sem Structural Equation Models1871166 vcd Visualizing Categorical Data1858967 XLConnect Excel Connector for R1823068 markdown Markdown rendering for R1821169 timeSeries Rmetrics – Financial Time Series Objects1793270 timeDate Rmetrics – Chronological and Calendar Objects1783871 RJSONIO Serialize R objects to JSON, JavaScript Object Notation1780172 cluster Cluster Analysis Extended Rousseeuw et al1713673 scatterplot3d 3D Scatter Plot1711074 nnet Feed-forward Neural Networks and Multinomial Log-Linear Models1707475 fBasics Rmetrics – Markets and Basic Statistics1627876 forecast Forecasting functions for time series and linear models1563877 quantreg Quantile Regression1550978 foreach Foreach looping construct for R1540579 chron Chronological objects which can handle dates and times1522680 plotrix Various plotting functions1514281 matrixcalc Collection of functions for matrix calculations1510782 aplpack Another Plot PACKage: stem.leaf, bagplot, faces, spin3R, and some slider functions1465483 strucchange Testing, Monitoring, and Dating Structural Changes1450384 iterators Iterator construct for R1444985 mgcv Mixed GAM Computation Vehicle with GCV/AIC/REML smoothness estimation1418686 kernlab Kernel-based Machine Learning Lab1413587 SparseM Sparse Linear Algebra1392188 tree Classification and regression trees1387189 robustbase Basic Robust Statistics1377890 vegan Community Ecology Package1368691 devtools Tools to make developing R code easier1348892 latticeExtra Extra Graphical Utilities Based on Lattice1325393 modeltools Tools and Classes for Statistical Models1323394 xlsx Read, write, format Excel 2007 and Excel 97/2000/XP/2003 files1309795 slam Sparse Lightweight Arrays and Matrices1306096 TTR Technical Trading Rules1289497 quantmod Quantitative Financial Modelling Framework1289298 relimp Relative Contribution of Effects in a Regression Model1269299 akima Interpolation of irregularly spaced data12680100 memoise Memoise functions12600R code
I hope you found this post useful, and will find new ways of using this interesting dataset. Note that there are issues with how much these numbers represent the “truth”, but for now, they are the most interesting estimate of it that I know of.
# get the latest installr package:if (!require('devtools')) install.packages('devtools'); require('devtools')install_github('installr', 'talgalili')require(installr) # read the data (this will take a LOOOONG time)RStudio_CRAN_data_folder <- download_RStudio_CRAN_data("2013-06-01")my_RStudio_CRAN_data <- read_RStudio_CRAN_data(RStudio_CRAN_data_folder) #optional, for smaller datasets:#my_RStudio_CRAN_data <- format_RStudio_CRAN_data(my_RStudio_CRAN_data)#class(my_RStudio_CRAN_data )# good for when getting the databack from saving it to RDS:# my_RStudio_CRAN_data <- readRDS("RStudio_CRAN_data_20130101_20130531.rds") # get the top 8 most downloaded pacakges:top_packages <- names(most_downloaded_packages(my_RStudio_CRAN_data,n = 8))# create a time plot of these packages:lineplot_package_downloads(pkg_names = top_packages, dataset = my_RStudio_CRAN_data) # download history for some other packages:lineplot_package_downloads(pkg_names = c("devtools", "roxygen2", "plyr", "reshape", "installr", "knitr"), dataset = my_RStudio_CRAN_data)lineplot_package_downloads(pkg_names = c("Deducer", "Rcmdr"), dataset = my_RStudio_CRAN_data) # Let's get the dendrogram:top_packages_counts <- most_downloaded_packages(my_RStudio_CRAN_data, 100)top_packages <- names(top_packages_counts)# only look at the top packages:ss <- my_RStudio_CRAN_data$package %in% top_packages # head(my_RStudio_CRAN_data[ss,])# create the indicator matrix:require(reshape)package_ip_id <- cast(my_RStudio_CRAN_data[ss,], package~ip_id, value = "country")package_ip_id[1:10,1:10] # look to see that it is fine.rownames(package_ip_id) <- package_ip_id[,1]package_ip_id <- package_ip_id[,-1]package_ip_id <- (package_ip_id > 0)mode(package_ip_id) <- "numeric"dend_package_ip_id <- as.dendrogram(hclust(dist(package_ip_id), method = "complete"))par(mar = c(.1 ,.1 ,.1, 3.8)) # c(5.1 ,4.1 ,4.1, 2.1)plot(dend_package_ip_id, horiz = TRUE, axes = F, nodePar = list(pch = c(NA,NA), lab.cex = .6))
p.s: This post is a follow up of me discovering, two days ago how many people use my R package.
R-bloggers.com offers daily e-mail updates about R news and tutorials on topics such as: visualization (ggplot2, Boxplots, maps, animation), programming (RStudio, Sweave, LaTeX, SQL, Eclipse, git, hadoop, Web Scraping) statistics (regression, PCA, time series, trading) and more...