Getting to the point – an alternative to the bezier arrow
The Physics of Finance 2013-05-22
 An alternative bezier arrow to the regular grid-bezier. Apart from a cool gradient it has the advantages of: exact width, exact start/end points and axis alignment.
About two weeks ago I got frustrated with the bezierGrob function in the grid package. The lwd parameter is interpreted differently depending on device, the arrow at the end does not follow the line but is perpendicular (probably following the spline control), and the line parameter makes it difficult to control exactly where the line starts/ends. Thus I decided to make my own fancy line with an arrow at the end – at the time I thought: How hard can it be? In retrospect, I wish I never thought of the thing… This article is about the painful process of creating of an alternative to the bezierGrob.
The end result
Based upon this article I have created two functions for generating these arrows, you can find them in my Gmisc-package, the bezierArrowSmpl and bezierArrowSmplGradient functions. Both functions should be fully documented, although the second one with the gradient is still somewhat of a beta as there are more features that I’m thinking of adding in the future. The first basic arrow is actually just a polygonGrob while the gradient arrow builds upon this one with a gradient layer on top – all merged into a gList grob. Grob stands for graphical object as defined by the grid-package. One day I also hope to convert these into proper grobs according to Paul Murrel’s grob-concept, but after skimming through the manual I quickly decided that it will have to wait for a while… right now I’m just happy that it works after a lot of debugging.
The process
So I started out with just generating some settings so that it would be easier to convert into a function later on.
12345678910111213141516
library(grid)default.units <- "npc"end_points <- list(start = list(x = 0.2, y = 0.2), end = list(x = 0.8, y = 0.6))spline_ctrl <- list(start = list(x = 0.5, y = 0.2), end = list(x = 0.5, y = 0.8))spline_ctrl$start$length <- sqrt((spline_ctrl$start$x - end_points$start$x)^2 + (spline_ctrl$start$y - end_points$start$y)^2)spline_ctrl$end$length <- sqrt((spline_ctrl$end$x - end_points$end$x)^2 + (spline_ctrl$end$y - end_points$end$y)^2)width <- unit(0.05, "npc") arrow <- list(base = unit(0.1, "npc"), length = unit(0.1, "npc")) gradient <- list(type = "triangle", decrease_prop = 0.4, start_prop = 0.25, clr_prop = 0.7, line_width = unit(8, "pt"), clr = "#2F4F2F") clr <- "#000000"
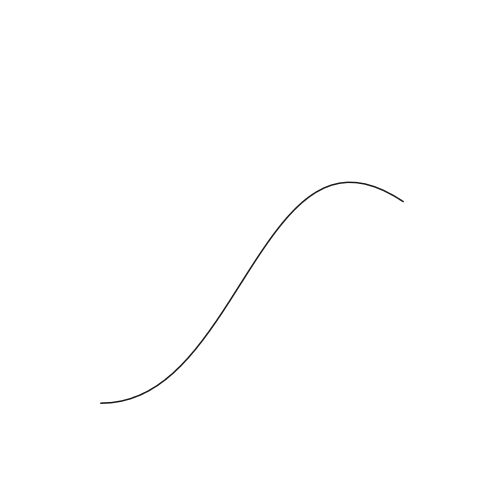
So by calling the bezierGrob function we get a nice curvy line.
123456
plot.new() bz_grob <- bezierGrob(x = c(end_points$start$x, spline_ctrl$start$x, spline_ctrl$end$x, end_points$end$x), y = c(end_points$start$y, spline_ctrl$start$y, spline_ctrl$end$y, end_points$end$y), default.units = "npc", gp = gpar(lwd = 2, col = grey(0.1)))grid.draw(bz_grob)
Next we get the actual points of the bezier curve. We also want the viewport’s values so we need to convert it all the values into npc. On top of this I prefer to remove the unit as this complicates the calculations.
12345678910111213
bp <- bezierPoints(bz_grob)bp$y <- convertY(bp$y, unitTo = default.units, valueOnly = TRUE)bp$x <- convertX(bp$x, unitTo = default.units, valueOnly = TRUE)getLength <- function(x, y) { m <- rbind(y, x) # Map the change between coordinates m <- m[, 2:ncol(m)] - m[, 1:(ncol(m) - 1)] # Set first element to 0 length m <- cbind(c(0, 0), m) # The old sqrt(a^2+b^2) formula return(sqrt(colSums(m^2)))}bp$lengths <- getLength(bp$x, bp$y)
Lets see if we can plot a polygon using the points. As you can see the width isn’t really as expected since the shift is only vertical.
123
pg <- polygonGrob(x = c(bp$x, rev(bp$x)), y = c(bp$y + 0.1, rev(bp$y - 0.1)), gp = gpar(fill = clr))grid.draw(pg)

Cutting the curve at the arrow
We want to cut the bezier curve so that we get an arrow of a certain length. This turned out to be a little tricky as I needed to find the point that is the closes corresponding one to my desired length.
1234567891011121314151617181920212223242526272829303132333435363738
getBestMatchForArrowLengthAlongCurve <- function(bp, arrow_length) { if (class(arrow_length) == "unit") arrow_length <- convertUnit(arrow_length, unitTo = default.units, valueOnly = TRUE) no_points <- length(bp$y) end_point <- list(x = bp$x[no_points], y = bp$y[no_points]) # Just a guess best_point <- round(no_points * 0.9) for (i in 1:no_points) { lb <- sqrt((bp$x[best_point] - end_point$x)^2 + (bp$y[best_point] - end_point$y)^2) l_plus <- sqrt((bp$x[best_point + 1] - end_point$x)^2 + (bp$y[best_point + 1] - end_point$y)^2) l_minus <- sqrt((bp$x[best_point - 1] - end_point$x)^2 + (bp$y[best_point - 1] - end_point$y)^2) best_diff <- abs(lb - arrow_length) plus_diff <- abs(l_plus - arrow_length) minus_diff <- abs(l_minus - arrow_length) if (best_diff < plus_diff && best_diff < minus_diff) return(best_point) else if (plus_diff < minus_diff) best_point <- best_point + 1 else best_point <- best_point - 1 # Reached the end without finding an optimal point if (best_point == 1 || best_point == no_points) { break } } warning("Could not find the optimal point along the line", " that would correspond to the desired arrow length") return(best_point)} bp$cut_point <- getBestMatchForArrowLengthAlongCurve(bp, arrow$length) # Set the arrow details according to this new informationarrow$x <- end_points$end$x - bp$x[bp$cut_point]arrow$y <- end_points$end$y - bp$y[bp$cut_point]arrow$length <- sqrt(arrow$x^2 + arrow$y^2)
Now lets see where that gets us.
1234567891011
end_points$end$new_x <- bp$x[bp$cut_point]end_points$end$new_y <- bp$y[bp$cut_point] new_bz_grob1 <- bezierGrob(x = c(end_points$start$x, spline_ctrl$start$x, spline_ctrl$end$x, end_points$end$new_x), y = c(end_points$start$y, spline_ctrl$start$y, spline_ctrl$end$y, end_points$end$new_y), default.units = default.units, gp = gpar(lwd = 4, col = "blue")) plot.new()grid.draw(bz_grob)grid.draw(new_bz_grob1)
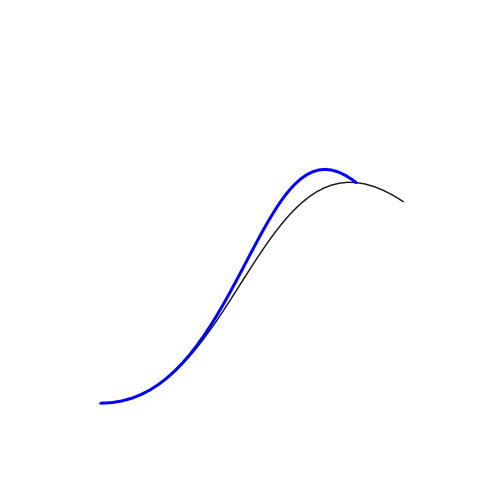
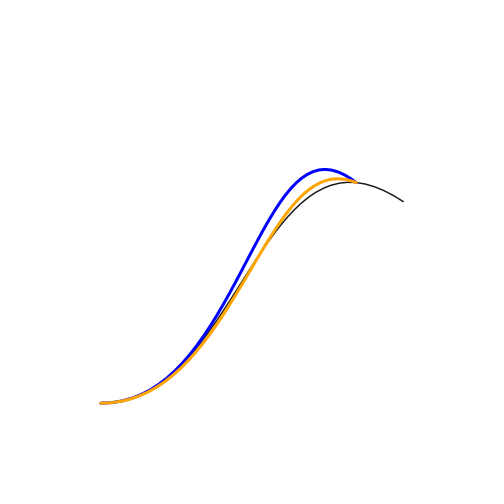
It seems rather obvious that we can’t use the same spline controls. The best solution is to adjust the spline control so that it matches the direction of the arrow. It’s not perfect but since I’m not familiar with the bezier generating code (the xspline function), it will have to do.
12345678910111213141516171819202122232425
getBezierAdjustedForArrow <- function(end_points, spline_ctrl, arrow) { multiplier <- (spline_ctrl$end$length - arrow$length * 1.5)/arrow$length # Use the arrow's vector in the opposite direction as the nwew ctrl point spline_ctrl$end$new_x <- -arrow$x * multiplier + bp$x[bp$cut_point] spline_ctrl$end$new_y <- -arrow$y * multiplier + bp$y[bp$cut_point] simple_start_adjustment <- 1 - arrow$length/sum(bp$lengths)/3 # Remove a fraction of the distance for the spline controles spline_ctrl$start$new_x <- end_points$start$x + (spline_ctrl$start$x - end_points$start$x) * simple_start_adjustment spline_ctrl$start$new_y <- end_points$start$y + (spline_ctrl$start$y - end_points$start$y) * simple_start_adjustment bezierGrob(x = c(end_points$start$x, spline_ctrl$start$new_x, spline_ctrl$end$new_x, end_points$end$new_x), y = c(end_points$start$y, spline_ctrl$start$new_y, spline_ctrl$end$new_y, end_points$end$new_y), default.units = default.units, gp = gpar(lwd = 4, col = "orange"))} new_bz_grob2 <- getBezierAdjustedForArrow(end_points, spline_ctrl, arrow) plot.new()grid.draw(bz_grob)grid.draw(new_bz_grob1)grid.draw(new_bz_grob2)
The rectangle
Now let’s kick of with the rectangle that we want. In this step we need to offset the lines by a certain amount. All those hours with linear algebra actually simplified it a little.
123456789101112131415161718192021222324252627282930313233343536373839404142434445464748495051525354555657585960616263646566676869707172737475767778798081828384858687888990919293949596979899100101102103104105106107108109110111112113114115116117118119120121122123124125126127128129130131132133134135136137138139140141142143144145
new_bp <- bezierPoints(new_bz_grob2)new_bp$y <- convertY(new_bp$y, unitTo = default.units, valueOnly = TRUE)new_bp$x <- convertX(new_bp$x, unitTo = default.units, valueOnly = TRUE)getBzLength <- function(x, y) { m <- rbind(y, x) # Map the change between coordinates m <- m[, 2:ncol(m)] - m[, 1:(ncol(m) - 1)] # Set first element to 0 length m <- cbind(c(0, 0), m) # The old sqrt(a^2+b^2) formula return(sqrt(colSums(m^2)))}new_bp$lengths <- getBzLength(new_bp$x, new_bp$y)# Add the arrow length to the last elementnew_bp$lengths[length(new_bp$lengths)] <- new_bp$lengths[length(new_bp$lengths)] + arrow$length #' Checks the input#'#' @param x The x point of the vector#' @param y The y point of the vector#' @param x_origo The x origin if other than 0#' @param y_origo The y origin if other than 0#' @return list with the input variables checked and#' converted if necessary.validateAndConvertVectorInputs <- function(x, y, x_origo = NA, y_origo = NA) { # Just som sanity input check if (class(y) != class(x)) stop("The x and y point don't have the same class,", " should be either numeric or units.", " Currently you have provided y=", class(y), " & x=", class(x)) if (is.na(x_origo) != is.na(y_origo)) stop("You mus specify both origo points!") if (is.na(x_origo)) { if ("unit" %in% class(y)) y_origo <- x_origo <- unit(0, attr(y, "unit")) else x_origo <- y_origo <- 0 } if (class(y_origo) != class(x_origo)) stop("The x and y point for the origo point don't have the same class,", " should be either numeric or units.", " Currently you have provided y=", class(y), " & x=", class(x)) if (class(y) != class(y_origo)) stop("The angle won't make any sense if your x and y point", " doesn't have the same unit as the origo x and y point.", " Currently you have provided point class=", class(y), " & origo class=", class(x)) return(list(y = y, x = x, y_origo = y_origo, x_origo = x_origo))} #' Gets an angle#'#' @param x The x point of the vector#' @param y The y point of the vector#' @param x_origo The x origin if other than 0#' @param y_origo The y origin if other than 0#' @return angle as defined by \code{\link{atan}}getVectorAngle <- function(x, y, x_origo = NA, y_origo = NA) { v <- validateAndConvertVectorInputs(x = x, y = y, x_origo = x_origo, y_origo = y_origo) if (class(v$y) == "unit") { y_diff <- convertY(v$y - v$y_origo, unitTo = default.units, valueOnly = TRUE) x_diff <- convertX(v$x - v$x_origo, unitTo = default.units, valueOnly = TRUE) } else { y_diff <- v$y - v$y_origo x_diff <- v$x - v$x_origo } return(atan(y_diff/x_diff))} #' Rotates a width to match a vector#'#' @param x The x point of the vector#' @param y The y point of the vector#' @param x_origo The x origin if other than 0#' @param y_origo The y origin if other than 0#' @param width The width of the desired up & down vectors#' @param perpendicular If the width is perpendicular to#' the provided vector the set this to true#' @param prev_angle If you want an average from this and the#' previous angle then set this parameter to the previous#' angle#'#' @return list A list with up & down vectors of c(x, y) format#' and a angle elementrotateWidth <- function(x, y, x_origo = NA, y_origo = NA, width = 0, default.units = "npc", perpendicular = TRUE, prev_angle = NA) { v <- validateAndConvertVectorInputs(x = x, y = y, x_origo = x_origo, y_origo = y_origo) angle <- getVectorAngle(x = x, y = y, x_origo = x_origo, y_origo = y_origo) working_angle <- mean(c(angle, prev_angle), na.rm = TRUE) rot_mtrx <- rbind(c(cos(working_angle), -sin(working_angle)), c(sin(working_angle), cos(working_angle))) # We need to convert the width into a scalar before we can work with it if (class(width) == "unit") { w_unit <- attr(width, "unit") w_scalar <- convertUnit(width, unitTo = w_unit, valueOnly = TRUE) } else { w_scalar <- width w_unit <- default.units } if (perpendicular) width_vector <- c(x = 0, y = w_scalar/2) else width_vector <- c(x = w_scalar/2, y = 0) up <- as.vector(rot_mtrx %*% width_vector) down <- -up # Convert back to units up <- unit(up, w_unit) down <- unit(down, w_unit) if ("unit" %in% class(v$x_origo)) { up <- up + unit.c(v$x_origo, v$y_origo) down <- down + unit.c(v$x_origo, v$y_origo) } else { up <- up + unit(c(v$x_origo, v$y_origo), default.units) down <- down + unit(c(v$x_origo, v$y_origo), default.units) } return(list(up = up, down = down, angle = angle))} getLines <- function(arrow, width, new_bp) { line_offset <- rotateWidth(x = arrow$x, y = arrow$y, width = width, perpendicular = TRUE) top <- list(x = unit.c(unit(new_bp$x, default.units) + line_offset$up[1]), y = unit.c(unit(new_bp$y, default.units) + line_offset$up[2])) bottom <- list(x = unit.c(unit(new_bp$x, default.units) + line_offset$down[1]), y = unit.c(unit(new_bp$y, default.units) + line_offset$down[2])) return(list(top = top, bottom = bottom))} line_offset <- rotateWidth(x = arrow$x, y = arrow$y, width = width, perpendicular = TRUE) lines <- getLines(arrow, width, new_bp)pg <- polygonGrob(x = unit.c(lines$top$x, rev(lines$bottom$x)), y = unit.c(lines$top$y, rev(lines$bottom$y)), gp = gpar(col = NA, fill = clr))plot.new()grid.draw(pg)

Although this may look a little artistic, it causes some issues, the line width should be perpendicular to each node. To get this we need to recalculate each node. Although theoretically it is time consuming, graphs shouldn’t be that sensitive to slow performance. There is probably a matrix short-cut, but then it would loose the width unit as the operations on a unit are limited. I also found it better to actually average the angle between the nodes.
1234567891011121314151617181920212223242526272829303132333435363738
getLines <- function(new_bp, arrow, width, default.units) { # This initiation is necessary due to the unit inflexibility up_down <- rotateWidth(x_origo = new_bp$x[1], y_origo = new_bp$y[1], x = new_bp$x[2], y = new_bp$y[2], width = width, perpendicular = TRUE) lines <- list(top = list(x = up_down$up[1], y = up_down$up[2]), bottom = list(x = up_down$down[1], y = up_down$down[2])) # Add the offset to the return variable addLineOffset <- function(x, y, lines, offset) { lines$top$x <- unit.c(lines$top$x, offset$up[1]) lines$top$y <- unit.c(lines$top$y, offset$up[2]) lines$bottom$x <- unit.c(lines$bottom$x, offset$down[1]) lines$bottom$y <- unit.c(lines$bottom$y, offset$down[2]) return(lines) } for (i in 2:(length(new_bp$x) - 1)) { up_down <- rotateWidth(x_origo = new_bp$x[i], y_origo = new_bp$y[i], x = new_bp$x[i + 1], y = new_bp$y[i + 1], width = width, perpendicular = TRUE, prev_angle = up_down$angle) lines <- addLineOffset(new_bp$x[i], new_bp$y[i], lines, up_down) } # For the last element use the arrow direction up_down <- rotateWidth(x = arrow$x + new_bp$x[i + 1], y = arrow$y + new_bp$y[i + 1], x_origo = new_bp$x[i + 1], y_origo = new_bp$y[i + 1], width = width, perpendicular = TRUE) lines <- addLineOffset(new_bp$x[i + 1], new_bp$y[i + 1], lines, up_down) return(lines)} lines <- getLines(new_bp, arrow, width, default.units) pg <- polygonGrob(x = unit.c(lines$top$x, rev(lines$bottom$x)), y = unit.c(lines$top$y, rev(lines$bottom$y)), gp = gpar(col = NA, fill = clr))plot.new()grid.draw(pg)

Now lets see if we can get the left side to be vertical.
123456789101112131415161718192021222324252627282930313233343536373839404142434445464748495051525354555657585960616263646566676869707172737475767778798081828384858687888990919293949596979899100101102103104105106107108109110
getLines <- function(new_bp, arrow, width, default.units, align_2_axis = TRUE) { # This initiation is necessary due to the unit inflexibility up_down <- rotateWidth(x_origo = new_bp$x[1], y_origo = new_bp$y[1], x = new_bp$x[2], y = new_bp$y[2], width = width, perpendicular = TRUE) lines <- list(top = list(x = up_down$up[1], y = up_down$up[2]), bottom = list(x = up_down$down[1], y = up_down$down[2])) # Add the offset to the return variable addLineOffset <- function(x, y, lines, offset) { lines$top$x <- unit.c(lines$top$x, offset$up[1]) lines$top$y <- unit.c(lines$top$y, offset$up[2]) lines$bottom$x <- unit.c(lines$bottom$x, offset$down[1]) lines$bottom$y <- unit.c(lines$bottom$y, offset$down[2]) return(lines) } for (i in 2:(length(new_bp$x) - 1)) { up_down <- rotateWidth(x_origo = new_bp$x[i], y_origo = new_bp$y[i], x = new_bp$x[i + 1], y = new_bp$y[i + 1], width = width, perpendicular = TRUE) lines <- addLineOffset(new_bp$x[i], new_bp$y[i], lines, up_down) } # For the last element use the arrow direction up_down <- rotateWidth(x = arrow$x + new_bp$x[i + 1], y = arrow$y + new_bp$y[i + 1], x_origo = new_bp$x[i + 1], y_origo = new_bp$y[i + 1], width = width, perpendicular = TRUE) lines <- addLineOffset(new_bp$x[i + 1], new_bp$y[i + 1], lines, up_down) # Start with the easy part, cutting off excess line shortenLine <- function(x, y, ref_x, ref_y, default.units, shorten_by_x = TRUE) { if ("unit" %in% class(x)) x <- convertX(x, unitTo = default.units, valueOnly = TRUE) if ("unit" %in% class(y)) y <- convertY(y, unitTo = default.units, valueOnly = TRUE) if ("unit" %in% class(ref_x)) ref_x <- convertX(ref_x, unitTo = default.units, valueOnly = TRUE) if ("unit" %in% class(ref_y)) ref_y <- convertY(ref_y, unitTo = default.units, valueOnly = TRUE) if (shorten_by_x) cut_point <- which(x < ref_x) + 1 else cut_point <- which(y < ref_y) + 1 x <- unit(c(ref_x, x[cut_point:length(x)]), default.units) y <- unit(c(ref_y, y[cut_point:length(y)]), default.units) return(list(x = x, y = y)) } # Adds the missing piece by generating another bezier curve for that # specific section extendLine <- function(x, y, ref_x, ref_y, default.units) { if ("unit" %in% class(x)) x <- convertX(x, unitTo = default.units, valueOnly = TRUE) if ("unit" %in% class(y)) y <- convertY(y, unitTo = default.units, valueOnly = TRUE) if ("unit" %in% class(ref_x)) ref_x <- convertX(ref_x, unitTo = default.units, valueOnly = TRUE) if ("unit" %in% class(ref_y)) ref_y <- convertY(ref_y, unitTo = default.units, valueOnly = TRUE) distanceX <- x[1] - ref_x distanceY <- y[1] - ref_y # Generate a grob for the remaining spline add_bg <- bezierGrob(x = c(x[1], x[1] + distanceX/2, x[1] + distanceX/2, ref_x), y = c(y[1], y[1], y[1] + distanceY/2, ref_y)) add_bg_pt <- bezierPoints(add_bg) add_x <- convertX(add_bg_pt$x, unitTo = default.units, valueOnly = TRUE) add_y <- convertY(add_bg_pt$y, unitTo = default.units, valueOnly = TRUE) x <- unit(c(add_x, x), default.units) y <- unit(c(add_y, y), default.units) return(list(x = x, y = y)) } angle <- getVectorAngle(x_origo = new_bp$x[1], y_origo = new_bp$y[1], x = new_bp$x[2], y = new_bp$y[2]) * 180/pi # If vertical if (angle < 45 && align_2_axis) { # Get the original points of interest org_offset <- rotateWidth(x_origo = new_bp$x[1], y_origo = new_bp$y[1], x = new_bp$x[1] + new_bp$x[1], y = new_bp$y[1], width = width, perpendicular = TRUE) # Check if to or bottom line is the shorter one if (new_bp$y[2] - new_bp$y[1] > 0) { # Top is shorter lines$top <- shortenLine(x = lines$top$x, y = lines$top$y, ref_x = org_offset$up[1], ref_y = org_offset$up[2], default.units = default.units, shorten_by_x = TRUE) lines$bottom <- extendLine(x = lines$bottom$x, y = lines$bottom$y, ref_x = org_offset$down[1], ref_y = org_offset$down[2], default.units = default.units) } else { lines$bottom <- shortenLine(x = lines$bottom$x, y = lines$bottom$y, ref_x = org_offset$down[1], ref_y = org_offset$down[2], default.units = default.units) lines$top <- extendLine(x = lines$top$x, y = lines$top$y, ref_x = org_offset$up[1], ref_y = org_offset$up[2], default.units = default.units) } } else if (align_2_axis) { # Horizontal } return(lines) } lines <- getLines(new_bp = new_bp, arrow = arrow, width = width, default.units = default.units) pg <- polygonGrob(x = unit.c(lines$top$x, rev(lines$bottom$x)), y = unit.c(lines$top$y, rev(lines$bottom$y)), gp = gpar(col = NA, fill = clr))plot.new()grid.draw(pg)

It looks OK with the vertical althought there as the angle increases to 45 degrees I should probably change the bezier adding code. Now lets finally add the arrow.
1234567891011121314151617181920212223242526
getLinesWithArrow <- function(new_bp, arrow, end_points, width, default.units, align_2_axis = TRUE) { lines <- getLines(new_bp = new_bp, arrow = arrow, width = width, default.units = default.units) tmp <- rotateWidth(x = arrow$x, y = arrow$y, width = arrow$base) arrow$up <- tmp$up arrow$down <- tmp$down lines$top$x <- unit.c(lines$top$x, lines$top$x[length(lines$top$x)] + arrow$up[1], unit(end_points$end$x, default.units)) lines$top$y <- unit.c(lines$top$y, lines$top$y[length(lines$top$y)] + arrow$up[2], unit(end_points$end$y, default.units)) lines$bottom$x <- unit.c(lines$bottom$x, lines$bottom$x[length(lines$bottom$x)] + arrow$down[1]) lines$bottom$y <- unit.c(lines$bottom$y, lines$bottom$y[length(lines$bottom$y)] + arrow$down[2]) return(lines)} lines <- getLinesWithArrow(new_bp = new_bp, arrow = arrow, end_points = end_points, width = width, default.units = default.units) pg <- polygonGrob(x = unit.c(lines$top$x, rev(lines$bottom$x)), y = unit.c(lines$top$y, rev(lines$bottom$y)), gp = gpar(col = NA, fill = clr))plot.new()grid.draw(pg)
![]()
The damn gradient
Now to the really tricky part, adding a color gradient. I did have a lot of fun in this section although in the end the debugging was really tiresome. This section is more expanded in the bezierArrowSmplGradient function.
123456789101112131415161718192021222324252627282930313233343536373839404142434445464748495051525354555657585960616263646566676869707172737475767778798081828384858687888990919293949596979899100101102103104105106107108109110111112
end_point <- which(cumsum(new_bp$lengths) >= sum(new_bp$lengths) * (gradient$start_prop + gradient$decrease_prop))[1] - 2start_decrease <- which(cumsum(new_bp$lengths) >= sum(new_bp$lengths) * (gradient$start_prop))[1] max_gradient_width <- convertUnit(width - gradient$line_width - gradient$line_width, unitTo = default.units, valueOnly = TRUE) clr_length <- which(cumsum(new_bp$lengths[end_point:1])/sum(new_bp$lengths[1:end_point]) >= gradient$clr_prop)[1]g_clrs <- colorRampPalette(colors = c(clr, gradient$clr))(clr_length) if (start_decrease != 1) { # Get the part of the line that has no decrease in size selection <- new_bp$x < new_bp$x[start_decrease] & new_bp$x > end_points$start$x + convertUnit(gradient$line_width, unitTo = default.units, valueOnly = TRUE) st_bp <- list(x = c(end_points$start$x + convertUnit(gradient$line_width, unitTo = default.units, valueOnly = TRUE), new_bp$x[selection]), y = c(end_points$start$y, new_bp$y[selection])) lines <- getLines(new_bp = st_bp, arrow = list(x = new_bp$x[start_decrease + 1], y = new_bp$y[start_decrease + 1]), width = max_gradient_width, default.units = default.units)} clipLinesEnd <- function(lines, no_elements_to_remove) { lines$top$x <- head(lines$top$x, -no_elements_to_remove) lines$top$y <- head(lines$top$y, -no_elements_to_remove) lines$bottom$x <- head(lines$bottom$x, -no_elements_to_remove) lines$bottom$y <- head(lines$bottom$y, -no_elements_to_remove) return(lines)}# Generate a list with all the elementsinner_gradient <- gList()if (end_point != start_decrease) { getTriangleGrowth <- function(l) { f <- (1 - rev(cumsum(l)/sum(l))) return(f/max(f)) } g_factor <- getTriangleGrowth(new_bp$lengths[start_decrease:end_point]) base <- rotateWidth(x = new_bp$x[end_point], y = new_bp$y[end_point], x_origo = new_bp$x[end_point - 1], y_origo = new_bp$y[end_point - 1], width = max_gradient_width * g_factor[1], default.units = default.units, perpendicular = TRUE) # Draw the top of the triangle gradient_pg <- polygonGrob(y = unit.c(unit(new_bp$y[end_point], default.units), base$up[2], base$down[2]), x = unit.c(unit(new_bp$x[end_point], default.units), base$up[1], base$down[1]), gp = gpar(fill = g_clrs[1], col = NA)) inner_gradient <- gList(inner_gradient, gradient_pg) for (i in (end_point - 2):start_decrease) { top <- base base <- rotateWidth(x = new_bp$x[i + 1], y = new_bp$y[i + 1], x_origo = new_bp$x[i], y_origo = new_bp$y[i], width = max_gradient_width * g_factor[end_point - i], perpendicular = TRUE, prev_angle = top$angle) gradient_pg <- polygonGrob(y = unit.c(top$up[2], top$down[2], base$down[2], base$up[2]), x = unit.c(top$up[1], top$down[1], base$down[1], base$up[1]), gp = gpar(fill = ifelse(end_point - i < length(g_clrs), g_clrs[end_point - i], tail(g_clrs, 1)), col = NA)) inner_gradient <- gList(inner_gradient, gradient_pg) }} else if (start_decrease != 1) { # Need to initiate the base just so that the rest will work base <- list(up = c(tail(lines$top$x, 1)[1], tail(lines$top$y, 1)[1]), down = c(tail(lines$bottom$x, 1)[1], tail(lines$bottom$y, 1)[1])) lines <- clipLinesEnd(lines, 1)} if (start_decrease != 1) { # Continue with gradient polygons if needed if (length(g_clrs) > end_point - start_decrease) { for (i in 1:(length(g_clrs) - (end_point - start_decrease))) { top <- base base <- list(up = unit(c(tail(lines$top$x, i)[1], tail(lines$top$y, i)[1]), default.units), down = unit(c(tail(lines$bottom$x, i)[1], tail(lines$bottom$y, i)[1]), default.units)) gradient_pg <- polygonGrob(y = unit.c(top$up[2], top$down[2], base$down[2], base$up[2]), x = unit.c(top$up[1], top$down[1], base$down[1], base$up[1]), gp = gpar(fill = g_clrs[end_point - start_decrease + i], col = NA)) inner_gradient <- gList(inner_gradient, gradient_pg) } } if (length(lines$bottom$x) > length(g_clrs) - (end_point - start_decrease)) { lines <- clipLinesEnd(lines, length(g_clrs) - (end_point - start_decrease)) gradient_pg <- polygonGrob(y = c(lines$top$y, convertY(base$up[2], unitTo = default.units, valueOnly = TRUE), convertY(base$down[2], unitTo = default.units, valueOnly = TRUE), rev(lines$bottom$y)), x = c(lines$top$x, convertX(base$up[1], unitTo = default.units, valueOnly = TRUE), convertX(base$down[1], unitTo = default.units, valueOnly = TRUE), rev(lines$bottom$x)), default.units = default.units, gp = gpar(fill = gradient$clr, col = NA)) } else { gradient_pg <- polygonGrob(y = c(lines$top$y[1], convertY(base$up[2], unitTo = default.units, valueOnly = TRUE), convertY(base$down[2], unitTo = default.units, valueOnly = TRUE), lines$bottom$y[1]), x = c(lines$top$x[1], convertX(base$up[1], unitTo = default.units, valueOnly = TRUE), convertX(base$down[1], unitTo = default.units, valueOnly = TRUE), lines$bottom$x[1]), default.units = default.units, gp = gpar(fill = gradient$clr, col = NA)) } inner_gradient <- gList(inner_gradient, gradient_pg)} plot.new()grid.draw(pg)grid.draw(inner_gradient) grid.draw(gList(pg, inner_gradient))

Phew… that’s it. In the actual code I’ve changed the top/bottom to left/right indicating the direction of the arrow. I’ve also added some other stuff to make it more general. If you have some suggestions for improvements or want to help out with creating proper grobs out of the functions it would be appreciated.
R-bloggers.com offers daily e-mail updates about R news and tutorials on topics such as: visualization (ggplot2, Boxplots, maps, animation), programming (RStudio, Sweave, LaTeX, SQL, Eclipse, git, hadoop, Web Scraping) statistics (regression, PCA, time series, trading) and more...