Nothing to sing about in Europe
Bill Mitchell - billy blog » Eurozone 2013-12-20
The Euro crisis is over! The Euro crisis is over! I suppose if one says it loudly enough and often enough it might drown out what the data tells us. The most recent data – inflation slowing, real GDP growth slowing, no movement on unemployment – tells us that while the politicians have an incentive to talk up the situation and proclaim the crisis is over, the reality is different. The fact that the bureaucrats are now realising that Eurozone budgets in many nations are not going to come close to meeting the harsh (revised) Stability and Growth Pact requirements tells us that the policy structures in place are not delivering on their promise. When a 0.1 per cent growth rate is celebrated you know something is amiss – that is how far standards have dropped in a region that cannot deliver sustained prosperity to its citizens as long as it ties a massive anchor round its feet! The industrialists and elites talk continually of structural reform – which is code for cutting workers pay and rights and retrenching welfare systems for the disadvantaged, the major structural weakness stares them in the face – unnoticed. That structural weakness is the flawed design of the monetary union. Until that is addressed the situation will limp along, perhaps get a surge of growth here and there, until the next major negative demand shock hits from somewhere (like the US, or China) and then the whole drama begins again. My morning news alerts from Europe included the following:
1. Italy and Spain close to breaking euro rules
2. Greece under fire as creditors lose patience
3. Eurozone economy still in troubled waters
Seems like good news to me. Although I was heartened that the President of the EC, José Manuel Barroso – Urges EU to avoid reform fatigue ….
This was in relation to the “budgetary surveillance announcements for the euro area”, which basically involves the Troika and the elite groups like the European Round Table of Industrialists (ERT) getting their heads together and working out how best to maintain their hegemony.
That is not the ERT (the state broadcasting service) that the Troika has shut down in Greece by the way!
It is nothing at all to do with reducing unemployment, improving workers’ pay and conditions. Indeed the ERT wants to cut employment protections, impose wage cuts on workers when they are receiving training, and impose generalised wage cuts to ensure pay is aligned to international competitiveness.
They also want to private all schools (make them competitive), and have control over curricula tuaght. You might enjoy reading this commentary – Business chiefs demand more austerity. It won’t surprise you.
The audacity of the elites really has no bounds. The crisis is a picnic for them. Not only have they been given massive state handouts to ensure the executive pay levels are maintained and increased but they get a platform – with lackeys like Barroso sucking it all up – to push for further retrenchment of the gains made over the last century by the trade union movement on behalf of the majority of us – that is, the workers.
The latest Eurostat national accounts data – Euro area GDP up by 0.1% and EU28 up by 0.2% – was published on November 14, 2013 and it showed that the third-quarter real GDP growth was slowing again.
The day after, Eurostat told us that – Euro area annual inflation down to 0.7%.
A renewed slowdown after years of recession and inflation falling quickly – that is not a sign of renewed prosperity or robust recovery.
Of the Eurozone nations, Belgium, Germany, Estonia, Ireland, Greece, France, Cyprus, Malta, Netherlands, Portugal are deflating, while Austria, Slovenia, Slovakia, and Spain are on the cusp of deflation (zero inflation rates in October 2013). Only Italy and Finland has a positive inflation rate for the month and then you would need a microscope to see it (0.1 per cent).
A deflationary environment typically means that a nation is experiencing a vicious cycle of declining wages and profits, property values, and increasing strain on all debtors.
For mortgage holders, negative equity looms when there is deflation, and unlike a situation where the property market slowdown is isolated, in these situations, nominal income growth is suppressed (falling) and so there is a pincer movement on the solvency of the debt holders.
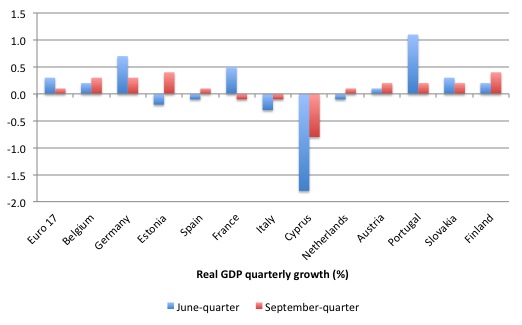
The GDP data was appalling and the EU avoided a triple-dip recession by the barest margins – 0.1 per cent real GDP growth – down from 0.3 per cent in the second-quarter. Remember that the June-quarter figure was heralded as the turning point in the crisis. One of many (dead-end) turning points.
The following graph shows the growth performance for the last two quarters for the EU17 nations that have third-quarter data available (there was no Eurostat data for Greece, Ireland, Luxembourg, Malta or Slovenia).
The data is not signalling robust recovery.
In weighted-average terms, France’s lapse back into negative growth is the main reason for the slowing growth result for the Eurozone as a whole. And despite a substantial trade surplus, Germany’s growth was only 0.3 per cent compared to 0.7 per cent in the June-quarter.
With the third-quarter data for Ireland not available I checked back on this second-quarter performance given that the Irish government announced last week that it was going back to the private bond markets. See story – http://euobserver.com/news/122113″>Ireland becomes first euro country to quit bailout programme.
I last examined the Irish situation when the first-quarter data was available – Ireland still located in the Irish Sea despite multibillion-euro austerity drive.
The – June-quarter data – released by the Central Statistics Office on September 19, 2013 tells us that in Irish real GDP growth was 0.4 per cent in the second-quarter.
But the devil is in the detail.
Consider the following graph which shows the evolution of personal consumption, government consumption and investment (indexed at 100 in the March 2008 quarter peak) to the June-quarter 2013.
The consumption index stands at 91.1 (compared to 100 at March 2008).
Investment now has an index number of 39.6 compared to 100 in the peak quarter March 2008. It has contracted for the last three quarters.
Both public and private spending have consistently headed in the same direction since fiscal austerity was imposed.
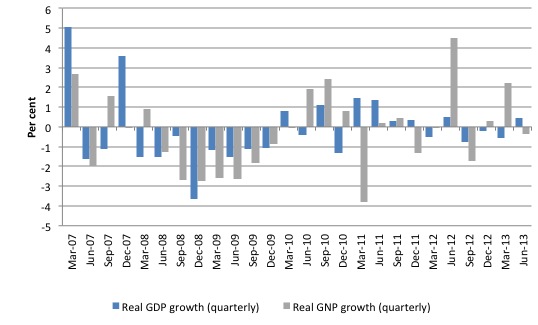
The following graph shows quarterly growth rates in real Gross Domestic Product (GDP) and Gross National Product (GNP) from the first quarter 2007 to the June-quarter 2013.
Real GDP grew by 0.4 in the second-quarter 2013 after decling by 0.6 per cent in the first-quarter of 2013. The growth arrests three consecutive contracting quarters and, in itself, is a good sign.
However, real Gross National Product (GNP) contracted by 0.4 per cent in the June-quarter 2013.
What does that mean?
First, what is the difference between GDP and GNP? This is a particularly important point when it comes to understanding the Irish predicament (both before the crisis and now).
You can gain a thorough understanding of these concepts from this excellent publication from the Australian Bureau of Statistics – Australian National Accounts: Concepts, Sources and Methods, 2000
The two concepts are defined as such:
- Gross domestic product (GDP) is defined as the market value of all final goods and services produced in a country in any given period.
- Gross National Product (GNP) is defined as the market value of all goods and services produced in any given period by labour and property supplied by the residents of a country.
So if GDP is rising – total output in Ireland is rising. If GNP is rising then the returns from production for Irish residents is rising. If GNP is falling (even if GDP is rising), the income benefits of the rising production are flowing out of the nation.
The Irish CSO publication says that GNP = GDP + Net factor income from the rest of the world (NFI). NFI is defined as:
Net factor income from the rest of the world (NFI) is the difference between investment income (interest, profits etc.,) and labour income earned abroad by Irish resident persons and companies (inflows) and similar incomes earned in Ireland by non-residents (outflows). The data are taken from the Balance of Payments statistics. However the components of interest flows involving banks in this item in the national accounts are constructed on the basis of “pure” interest rates (that is exclusive of FISIM) whereas in the balance of payments the FISIM adjustment is not carried out. There is an equal and opposite adjustment then made to the imports and exports of services in the national accounts which is not made to these items in the balance of payments. The deflator used to generate the constant price figures is based on the implied quarterly price index for the exports of goods and services. In some years exceptional income payments have had to be deflated individually.
In this blog – The sick Celtic Tiger getting sicker – I argued that the so-called “Celtic Tiger” growth miracle was an illusion and was driven by major US corporations evading US tax liabilities by exploiting massive tax breaks supplied to them by the Irish government.
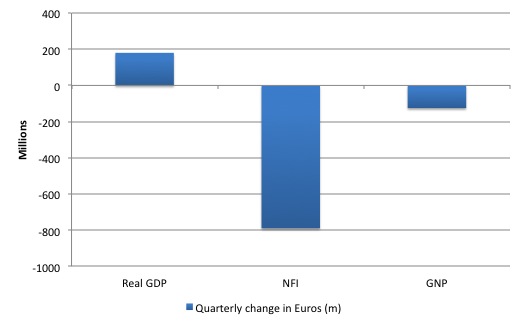
The following graph shows the changes (in millions of Euros) for the second-quarter 2013 in real GDP, GNP and NFI. The data tells us that the return to growth in Ireland in the June-quarter was of little benefit in income flows to the Irish people.
The other signal that things are not yet very bright in Ireland is the behaviour of private investment (noted above).
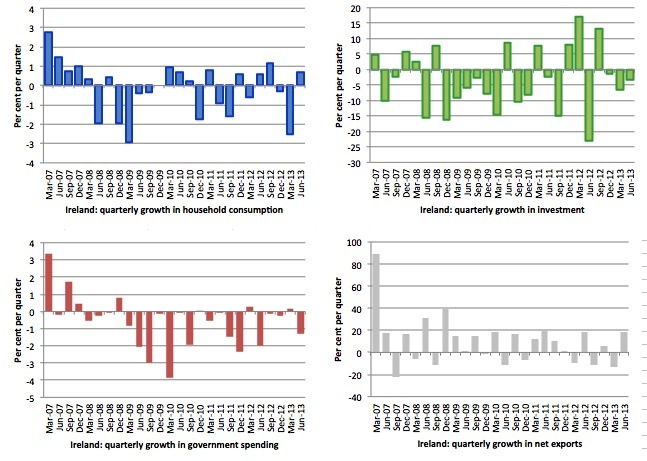
The following graph shows the quarterly growth in the major spending aggregates since the downturn took hold in Ireland (March quarter 2007).
1. Personal consumption growth was positive in the June-quarter after declining for the previous two quarters (plunging in the March-quarter 2013) and remains well below its pre-austerity levels.
2. Government spending growth has been aggressively negative.
3. Private investment (capital formation) continues to decline.
4. Net exports was positive in the June-quarter but the positive-negative pattern has not yet been broken and with the rest of Europe slowing the outlook cannot be very bright as yet.
Overall, Ireland’s growth strategy has been based on increasing exports of real goods and services which are a cost to the domestic economy (forgoing local use). Further, any growth dividend is being expatriated to foreigners as rising income.
The only conclusion you can draw at this stage is that the austerity package is further impoverishing the local residents and handing over increasing quantities of Ireland’s real resources to the benefit of foreigners. That doesn’t sound like a very attractive option to me.
Conclusion
Not much time today. I was going to examine the indicators that Eurostat has put out under the “early detection of macroeconomic imbalances” but I will do that another day.
That is enough for today!
(c) Copyright 2013 Bill Mitchell. All Rights Reserved.


