Guest post: 2016 U.S. Patent Practitioner Trends Part 2 – Removal and Retirement of Patent Practitioners
Patent – Patently-O 2016-07-31
By Zachary Kinnaird, Patent Attorney with International IP Law Group, PLLC
Based on my analysis of the USPTO roster data:
- There were 44,295 registered patent practitioners in the U.S. as of April 2016.
- After 20 years on the USPTO roster, at least 15% of practitioners originally registered between 1988 and 1996 are no longer registered as of April 2016.
- Going back from April 2016, every subsequent year before 1986 shows an additional 2% of patent practitioners are no longer registered.
- The USPTO either skipped or removed a large number of registration numbers originally to be assigned in 1964, 1966, and 2001 for currently unclear reasons.
Retirement trends based on removals from the USPTO roster
The number of practitioners removed from the USPTO database reveals a practitioner percentage removal trend that can be seen as a retirement estimate for patent practitioners. This trend shows that the longer a practitioner has had a registration number, the more likely they are to have retired, or otherwise been removed, from the roster.
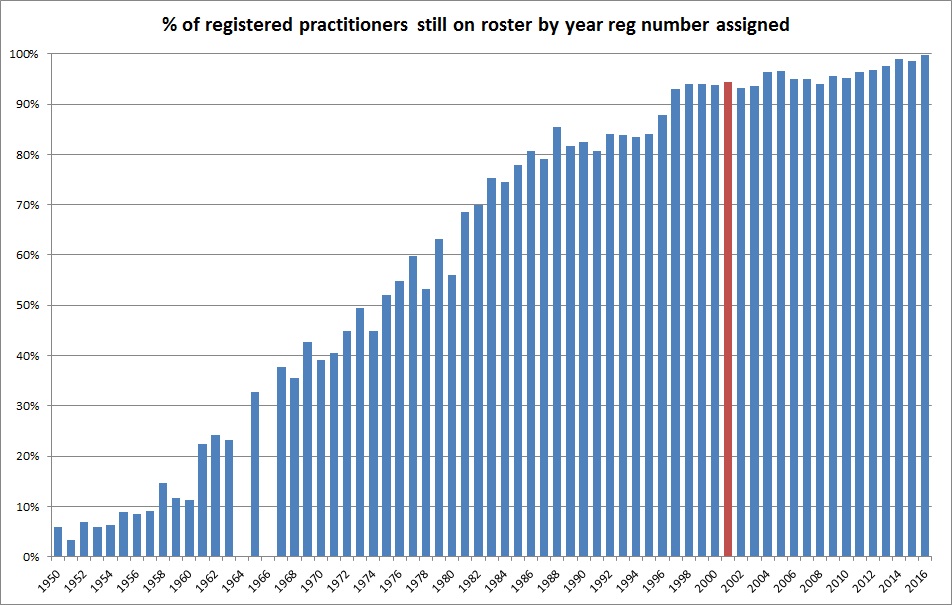
The chart below shows the percentage of patent practitioners who still remain registered on the USPTO roster as a function of each practitioner’s year of registration. The further to the right, the more recently the practitioner earned their registration number.
*Gaps years 1964, 1966 removed as likely outliers as discussed more below
** Value for 2001 shown in red as data for 2001 came from the USPTO Official Gazette rather than from a calculation from the USPTO database. Data for 2001 from USPTO database calculations was an outlier as discussed more below
From the graph above, there appears to be an initial sudden dip at 1996 that suggests that about 15% of practitioners leave the practice after 20 years of being registered agents and attorneys. These numbers stay fairly level for another 10 years on the roster, or back until 1986 before another large dip in the percentage of practitioners still registered. The trend after this first 30 years on the roster is a nearly linearly removal at a rate of approximately 2% a year. This retirement pattern continues until 55 years after initial registration, or 1960 in the above chart.
At the time this data was collected, there were 44,295 individuals in the USPTO database, however there are likely far fewer than this actively filing or prosecuting patents with the USPTO. The percentages of practitioners still on the roster are very likely to be higher than in actual practicing attorneys and agents. Remaining on the roster is relatively costless for a practitioner due to the lack of dues and continuation education requirements. It is likely that many practitioners have effectively retired without yet being removed from the roster. Accordingly, the percentages shown on the above graph are a ceiling of the actual figures of practitioners who are actually still practicing.
Tracking removal rates of registered attorneys from the USPTO roster
The above retirement graph was generated from percentages of practitioners removed from the USPTO database. Finding the percentage of those removed can be a challenge, however, as the USPTO only maintains the current state of the patent bar in its public database and does not publicly provide a list of all practitioners ever registered at the USPTO.
Instead, the Office of Enrollment and Discipline periodically conducts a mandatory survey of active registered practitioners pursuant to 37 C.F.R. § 11.11. This survey, in part, determines if the practitioner is still active and wants to remain on the USPTO roster. As noted above, there is essentially no cost to remain on the roster as there are currently no annual dues or continuing education requirements. However, if a practitioner is no longer practicing and either indicates the end of their practice in the survey or does not respond to the survey, the USPTO removes that practitioner from the roster.
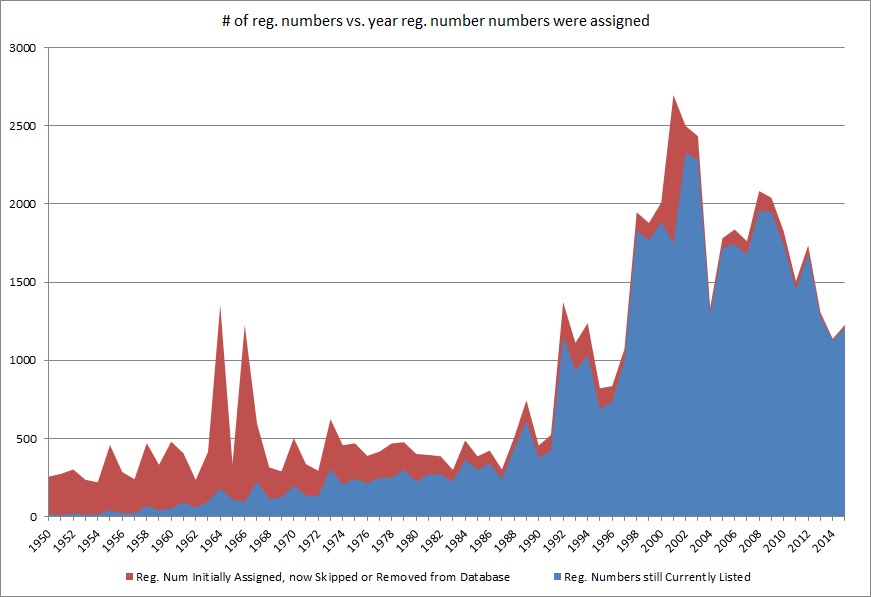
The below graph is constructed with the knowledge that practitioners can be removed through this survey system and by assuming that the USPTO assigns numbers in a sequential order. This visualization shows the number of registration numbers removed each year compared to the number of registration numbers initially assigned in that given year. For instance, while the USPTO roster may include 1,210 practitioners who first gained registration numbers in 2015, the first registration number assigned in 2015 (i.e. 73,303) compared to the last registration number assigned in 2015 (i.e. 74,530) suggests that 1,227 registration numbers were actually assigned in 2015 and that some of these 2015 practitioners have already been removed from the database. Carrying out this calculation for each year going back to 1950 yields the graph below.
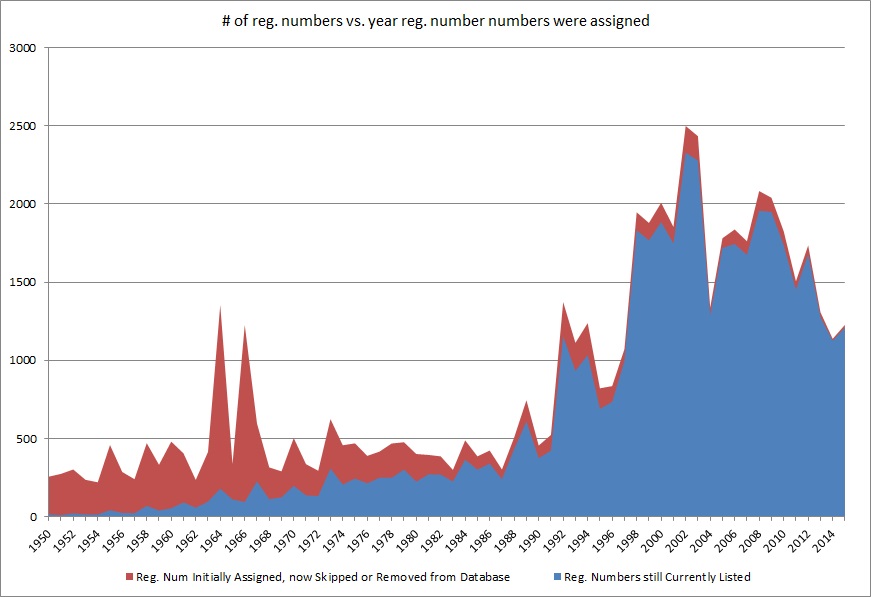
As noted above, there are unusual red spikes in 1964, 1966, and 2001. The red spikes corresponding to 1964 and 1966 are far out of place and I believe they are likely outliers. The red spike in 2001 IS an outlier. This can be said with confidence based on comparison to number of practitioners found in the USPTO Gazette for the year of 2001. Potential practitioners in the PTO Gazette are listed provisionally to allow time for the public to report any additional information about the practitioners before they formally receive a registration number. 1,853 potential practitioners were listed for 2001 in the USTPO Official Gazette compared to the calculated value difference of 2,697 between the first registration number assigned in 2001 and the last. The corrected graph below reflects the modified value for 2001 based on the Official Gazette listings. Unfortunately, the listing of potential practitioners in the online resources of the Official USPTO Gazette currently only goes back as far as 1995 and can’t be used to find values for 1964 and 1966.
The outlier variation in 2001 is likely due to a conscious choice by the USPTO to jump to a higher registration number for assignment rather than adhere to a generally sequential and quantum assignment of registration numbers. This is likely true for 1966 and 1964 as well. For example, at the end of 1966 the last registration number assigned was 23,099 which is followed by a jump to 24,002 on the very next day numbers were assigned. These gaps suggest that there may have been a USPTO policy at the time to skip blocks of numbers and perhaps start at the next round number in the sequence (e.g. 24,000 in 1967) at the start of a next year.
Data Retrieval Methodology
The USPTO provides both a database for practitioner information as well as a zip file of this data in spreadsheet form that is updated daily. However, the spreadsheet provided by the USPTO does not include the dates of registration as an attorney or agent. Accordingly, the process of retrieving the registration date information from the USPTO online database was automated with web macros to yield the data that is analyzed in this post. As many practitioners have been registered as both patent agents and as patent attorneys, only the date an individual first received a registration number was used for this analysis. For access to the data set being used, or if any errors are noticed, please feel free to reach out by email.
This article is a continuation and extension of my previous analysis on the USPTO database graphing the USPTO attorney and agent database as well as my update to that story as of April 30, 2016.
Editor’s note: Comment moderation policy is in effect. Excessive or uncivil posts will be deleted without further notice.


