Citing References
Patent – Patently-O 2017-09-05
For patents issued thus far in 2017, the average patent lists 44 references submitted by the patent applicant for the examiner to consider. The median patent, however, only has 10 applicant cited references. The gulf between the mean and median is the result in skew in the dataset — here caused by a fairly small percentage of patents that cite a disproportionately large number of references. Thus, if you pick a few patents at random, about half of them will have <10 references cited by the applicant. Every once in a while, though, you’ll come across a big papi – see, for example U.S. Patent No. 9,535,563 and its 7,800 references cited by the applicant (inventor-patent attorney Steven Hoffberg). At the other end of the spectrum, about 12% of applicants cite no prior art at all — this is down from about 20% in 2005.
One way to think about the skew is to look patents where applicants submit cite 250+ references — that represents about 3.5% of patents issued in 2017 thus far (though only 0.5% of patents issued in 2005). Those 3.5% of issued patents account for half of the prior art submitted to the PTO.
To be clear – I’m not demonizing patentees who submit lots of references. What I’m working toward is whether the large number of references creates any special difficulty or benefits for the examination process and whether examiners receive any special assistance in considering the large number of references submitted.
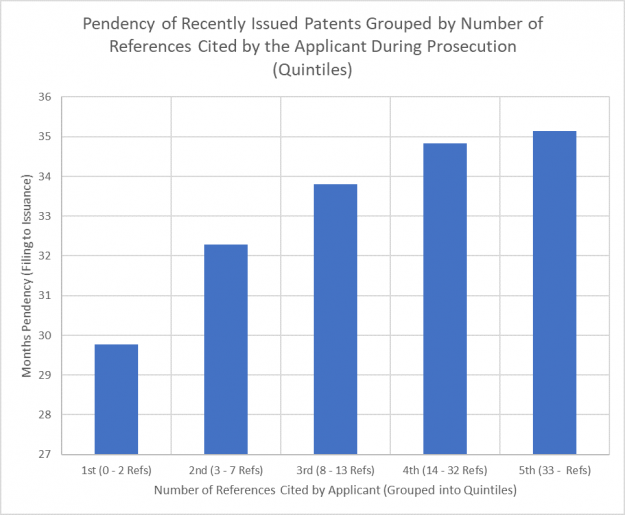
I think the chart below is interesting. I took the 2017 patents and grouped them in quintiles according to the number of references cited. For each quartile, I then found the average pendency (in months) for the issued patents. The results are clear – patents with more citations correlate with longer pendency. (Note that the auto-created axis does not reach ZERO – this makes the slope appear more dramatic than reality). Obviously we should be a bit cautious in interpreting this chart as suggesting a causal role.