Nines of safety: a proposed unit of measurement of risk
What's new 2021-10-05
In everyday usage, we rely heavily on percentages to quantify probabilities and proportions: we might say that a prediction is 


- (i) In a two-party election, an outcome of say
to
might be considered close, but
to
would probably be viewed as a convincing mandate, and
to
would likely be viewed as a landslide.
- (ii) Similarly, if one were to poll an upcoming election, a poll of
- (iii) On the other hand, a medical operation that only had a
or
likely to be non-fatal (i.e., a
or
chance of death) would not be conducted lightly.
- (iv) A weather prediction of, say,
chance of rain during a vacation trip might be sufficient cause to pack an umbrella, even though it is more likely than not that rain would not occur. On the other hand, if the prediction was for an
- (v) Even extremely tiny percentages of toxic chemicals in everyday products can be considered unacceptable. For instance, EPA rules require action to be taken when the percentage of lead in drinking water exceeds
(15 parts per billion). At the opposite extreme, recycling contamination rates as high as
Because of all the very different ways in which percentages could be used, I think it may make sense to propose an alternate system of units to measure one class of probabilities, namely the probabilities of avoiding some highly undesirable outcome, such as death, accident or illness. The units I propose are that of “nines“, which are already commonly used to measure availability of some service or purity of a material, but can be equally used to measure the safety (i.e., lack of risk) of some activity. Informally, nines measure how many consecutive appearances of the digit 
-
-
success = two nines of safety
-
success = three nines of safety
Definition 1 (Nines of safety) An activity (affecting one or more persons, over some given period of time) that has a probabilityof the “safe” outcome and probability
of the “unsafe” outcome will have
nines of safety against the unsafe outcome, where
(where
is the logarithm to base ten), or equivalently


Remark 2 Because of the various uncertainties in measuring probabilities, as well as the inaccuracies in some of the assumptions and approximations we will be making later, we will not attempt to measure the number of nines of safety beyond the first decimal point; thus we will round to the nearest tenth of a nine of safety throughout this post.
Here is a conversion table between percentage rates of success (the safe outcome), failure (the unsafe outcome), and the number of nines of safety one has:
Success rate Failure rate Number of nines 


 infinite
 Thus, if one has no nines of safety whatsoever, one is guaranteed to fail; but each nine of safety one has reduces the failure rate by a factor of 
Remark 3 The number of nines of safety against a certain risk is not absolute; it will depend not only on the risk itself, but (a) the number of people exposed to the risk, and (b) the length of time one is exposed to the risk. Exposing more people or increasing the duration of exposure will reduce the number of nines, and conversely exposing fewer people or reducing the duration will increase the number of nines; see Proposition 7 below for a rough rule of thumb in this regard.
Remark 4 Nines of safety are a logarithmic scale of measurement, rather than a linear scale. Other familiar examples of logarithmic scales of measurement include the Richter scale of earthquake magnitude, the pH scale of acidity, the decibel scale of sound level, octaves in music, and the magnitude scale for stars.
Remark 5 One way to think about nines of safety is via the Swiss cheese model that was created recently to describe pandemic risk management. In this model, each nine of safety can be thought of as a slice of Swiss cheese, with holes occupying
Now to give some real-world examples of nines of safety. Using data for deaths in the US in 2019 (without attempting to account for factors such as age and gender), a random US citizen will have had the following amount of safety from dying from some selected causes in that year:
Cause of death Mortality rate per (approx.) Nines of safety All causes
  Heart disease
  Cancer
  Accidents
  Drug overdose
  Influenza/Pneumonia
 Suicide
  Gun violence
 Car accident
  Murder
 Airplane crash
 Lightning strike

The safety of air travel is particularly remarkable: a given hour of flying in general aviation has a fatality rate of 


Of course, in 2020, COVID-19 deaths became significant. In this year in the US, the mortality rate for COVID-19 (as the underlying or contributing cause of death) was 
Some further illustrations of the concept of nines of safety:
- Each round of Russian roulette has a success rate of
, providing only
nines of safety. Of course, the safety will decrease with each additional round: one has only
nines of safety after two rounds,
nines after three rounds, and so forth. (See also Proposition 7 below.)
- The ancient Roman punishment of decimation, by definition, provided exactly one nine of safety to each soldier being punished.
- Rolling a
on a
-sided die is a risk that carries about
- Rolling a double one (“snake eyes“) from two six-sided dice carries about
- One has about
- A null hypothesis has
statistically significant result, and
statistically significant result. (However, one has to be careful when reversing the conditional; a
- If a poker opponent is dealt a five-card hand, one has
nines of safety against that opponent being dealt a royal flush,
against a straight flush or higher,
against a full house or higher,
against a flush or higher,
against a straight or higher,
against three-of-a-kind or higher,
against two pairs or higher, and just
- A
nines of safety against a single guess. (For the reduction in safety caused by multiple guesses, see Proposition 7 below.)
Here is another way to think about nines of safety:
Proposition 6 (Nines of safety extend expected onset of risk) Suppose a certain risky activity has.
Proof: The probability that the risk is activated after exactly 
Thus, for instance, if one performs some risky activity daily, then the expected length of time before the risk occurs is given by the following table:
Daily nines of safety Expected onset of risk One day One week One month One year
  Two years Five years Ten years Twenty years Fifty years
  A century
 Or, if one wants to convert the yearly risks of dying from a specific cause into expected years before that cause of death would occur (assuming for sake of discussion that no other cause of death exists):
Yearly nines of safety Expected onset of risk One year Two years Five years Ten years Twenty years Fifty years A century These tables suggest a relationship between the amount of safety one would have in a short timeframe, such as a day, and a longer time frame, such as a year. Here is an approximate formalisation of that relationship:
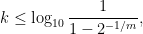
Proposition 7 (Repeated exposure reduces nines of safety) If a risky activity withtimes, then (assuming
nines of safety. Conversely: if the repeated activity has
nines of safety, the individual activity will have approximately
nines of safety.
Proof: An activity with 


Remark 8 The hypothesis of independence here is key. If there is a lot of correlation between the risks between different repetitions of the activity, then there can be much less reduction in safety caused by that repetition. As a simple example, suppose that; but in this case there is perfect correlation, and in fact the number of nines of safety remains steady at
Because of this caveat, one should view the above proposition as only a crude first approximation that can be used as a simple rule of thumb, but should not be relied upon for more precise calculations.
One can repeat a risk either in time (extending the time of exposure to the risk, say from a day to a year), or in space (by exposing the risk to more people). The above proposition then gives an additive conversion law for nines of safety in either case. Here are some conversion tables for time:
From/to Daily Weekly Monthly Yearly Daily 0 -0.8 -1.5 -2.6 Weekly +0.8 0 -0.6 -1.7 Monthly +1.5 +0.6 0 -1.1 Yearly +2.6 +1.7 +1.1 0 From/to Yearly Per 5 yr Per decade Per century Yearly 0 -0.7 -1.0 -2.0 Per 5 yr +0.7 0 -0.3 -1.3 Per decade +1.0 + -0.3 0 -1.0 Per century +2.0 +1.3 +1.0 0For instance, as mentioned before, the yearly amount of safety against cancer is about 


Now we turn to conversions in space. If one knows the level of safety against a certain risk for an individual, and then one (independently) exposes a group of such individuals to that risk, then the reduction in nines of safety when considering the possibility that at least one group member experiences this risk is given by the following table:
Group Reduction in safety You ( person) You and your partner ( people)
  You and your parents (
 people)
  You, your partner, and three children ( people)
  An extended family of people
  A class of
  people
  A workplace of
  people
  A school of
  people
  A university of
  people
  A town of people
  A city of million people
  A state of million people
  A country of million people
  A continent of billion people
  The entire planet
For instance, in a given year (and making the somewhat implausible assumption of independence), you might have 


In the opposite direction, any reduction in exposure (either in time or space) to a risk will increase one’s safety level, as per the following table:
Reduction in exposure Additional nines of safety


For instance, a five-fold reduction in exposure will reclaim about
Here is a slightly different way to view nines of safety:
Proposition 9 Suppose that a group ofnines of individual safety against that risk, then there is at least a
Proof: If individually there are
Thus, for a group to collectively avoid a risk with at least a
person) You and your partner ( people) You and your parents ( people) You, your partner, and three children ( people)  An extended family of people
  A class of people A workplace of people
  A school of people
  A university of people
  A town of people
  A city of million people
  A state of million people A country of million people
  A continent of billion people
  The entire planet
For large 
Precautions that can work to prevent a certain risk from occurring will add additional nines of safety against that risk, even if the precaution is not
Proposition 10 (Precautions add nines of safety) Suppose an activity carriesnines of safety (that is to say, the probability that the protection is effective is
). Then applying that precaution increases the number of nines in the activity from
.
Proof: The probability that the precaution fails and the risk then occurs is 
In particular, we can repurpose the table at the start of this post as a conversion chart for effectiveness of a precaution:
Effectiveness Failure rate Additional nines provided 


 infinite
 Thus for instance a precaution that is 

A slight variant of the above rule can be stated using the concept of relative risk:
Proposition 11 (Relative risk and nines of safety) Suppose an activity carries. Then the action removes
nines of safety (if
) or adds
nines of safety (if
) to the original activity.
Proof: The additional action adjusts the probability of failure from 

Here is a conversion chart between relative risk and change in nines of safety:
Relative risk Change in nines of safety


Some examples:
- Smoking increases the fatality rate of lung cancer by a factor of about
- Seatbelts reduce the fatality rate in car accidents by a factor of about two, adding about
, adding about
additional nines of safety.
- As far as transmission of COVID is concerned, it seems that constant use of face masks reduces transmission by a factor of about five (thus adding about
The effect of combining multiple (independent) precautions together is cumulative; one can achieve quite a high level of safety by stacking together several precautions that individually have relatively low levels of effectiveness. Again, see the “swiss cheese model” referred to in Remark 5. For instance, if face masks add
In summary, when debating the value of a given risk mitigation measure, the correct question to ask is not quite “Is it certain to work” or “Can it fail?”, but rather “How many extra nines of safety does it add?”.
As one final comparison between nines of safety and other standard risk measures, we give the following proposition regarding large deviations from the mean.
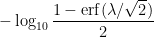
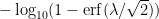
Proposition 12 Letbe a normally distributed random variable of standard deviation
, and let
. Then the “one-sided risk” of
by at least
(i.e.,
) carries
nines of safety, the “two-sided risk” of
) carries
nines of safety, where
is the error function.
Proof: This is a routine calculation using the cumulative distribution function of the normal distribution.
Here is a short table illustrating this proposition:
Number of deviations from the mean One-sided nines of safety Two-sided nines of safety


Thus, for instance, the risk of a five sigma event (deviating by more than five standard deviations from the mean in either direction) should carry
See also this older essay I wrote on anonymity on the internet, using bits as a measure of anonymity in much the same way that nines are used here as a measure of safety.