Categories for Public Health Modeling
Azimuth 2025-09-11
How, exactly, can category theory help modeling in public health? I wrote a paper about this with two people who helped run Canada’s COVID modeling, together with a software engineer and a mathematician at the Topos Institute:
• John Baez, Xiaoyan Li, Sophie Libkind, Nathaniel D. Osgood and Eric Redekopp, A categorical framework for modeling with stock and flow diagrams, in Mathematics of Public Health: Mathematical Modelling from the Next Generation, eds. Jummy David and Jianhong Wu, Springer, 2023, pp. 175-207.
Anything you can with category theory, you can also do without it—just like you can cross the Alps without shoes. But categorical methods make public health modeling easier in a lot of ways.
The introduction lists a few of these ways. Then the paper goes on to provide details, including a long appendix showing actual Julia code for our software.
But here’s the basic idea:
Many people working on epidemiological modeling like diagrams because they provide easily understandable but informal steps towards a mathematically rigorous formulation of a model in terms of ordinary differential equations (ODEs). But ODEs are typically opaque to non-modelers—including the interdisciplinary members of the teams that typically are required for impactful models.
The tradition of modeling called System Dynamics places a premium on engagement with stakeholders, so it offers a modeling approach centered around diagrams. This approach commonly proceeds in a manner that depicts model structure using successively more detailed models.
The process starts with a ‘causal loop diagram’ illustrating causal connections and feedback loops:

It then often proceeds to a ‘system structure diagram’, which distinguishes stocks from flows but still lacks quantitative information. The next step is to construct a stock and flow diagram’:

This diagram is visually identical to the system structure diagram, but it also includes formulae (at the bottom here).
The stock–flow diagram is treated as the durable end result of this modeling process, since it uniquely specifies a system of first-order ODEs. System Dynamics modeling typically then alternates between assessing scenario outcomes resulting from numerically integrating the ODEs, performing other analyses (e.g., identifying location or stability of equilibria), and elaborating the stock-flow diagram.
While each of the 3 types of diagrams in the System Dynamics tradition is recommended by visual accessibility, the traditional approach suffers from a number of practical shortcomings:
• Monolithic models: Models are traditionally built up in a monolithic fashion, leading ultimately to a single large piece of code. Drawn as a single diagram, a model can be extremely complex. For example, here is Canada’s main model of COVID during the pandemic, put together by Nathaniel Osgood and Xiaoyan Li, made using the commercially available software called AnyLogic:
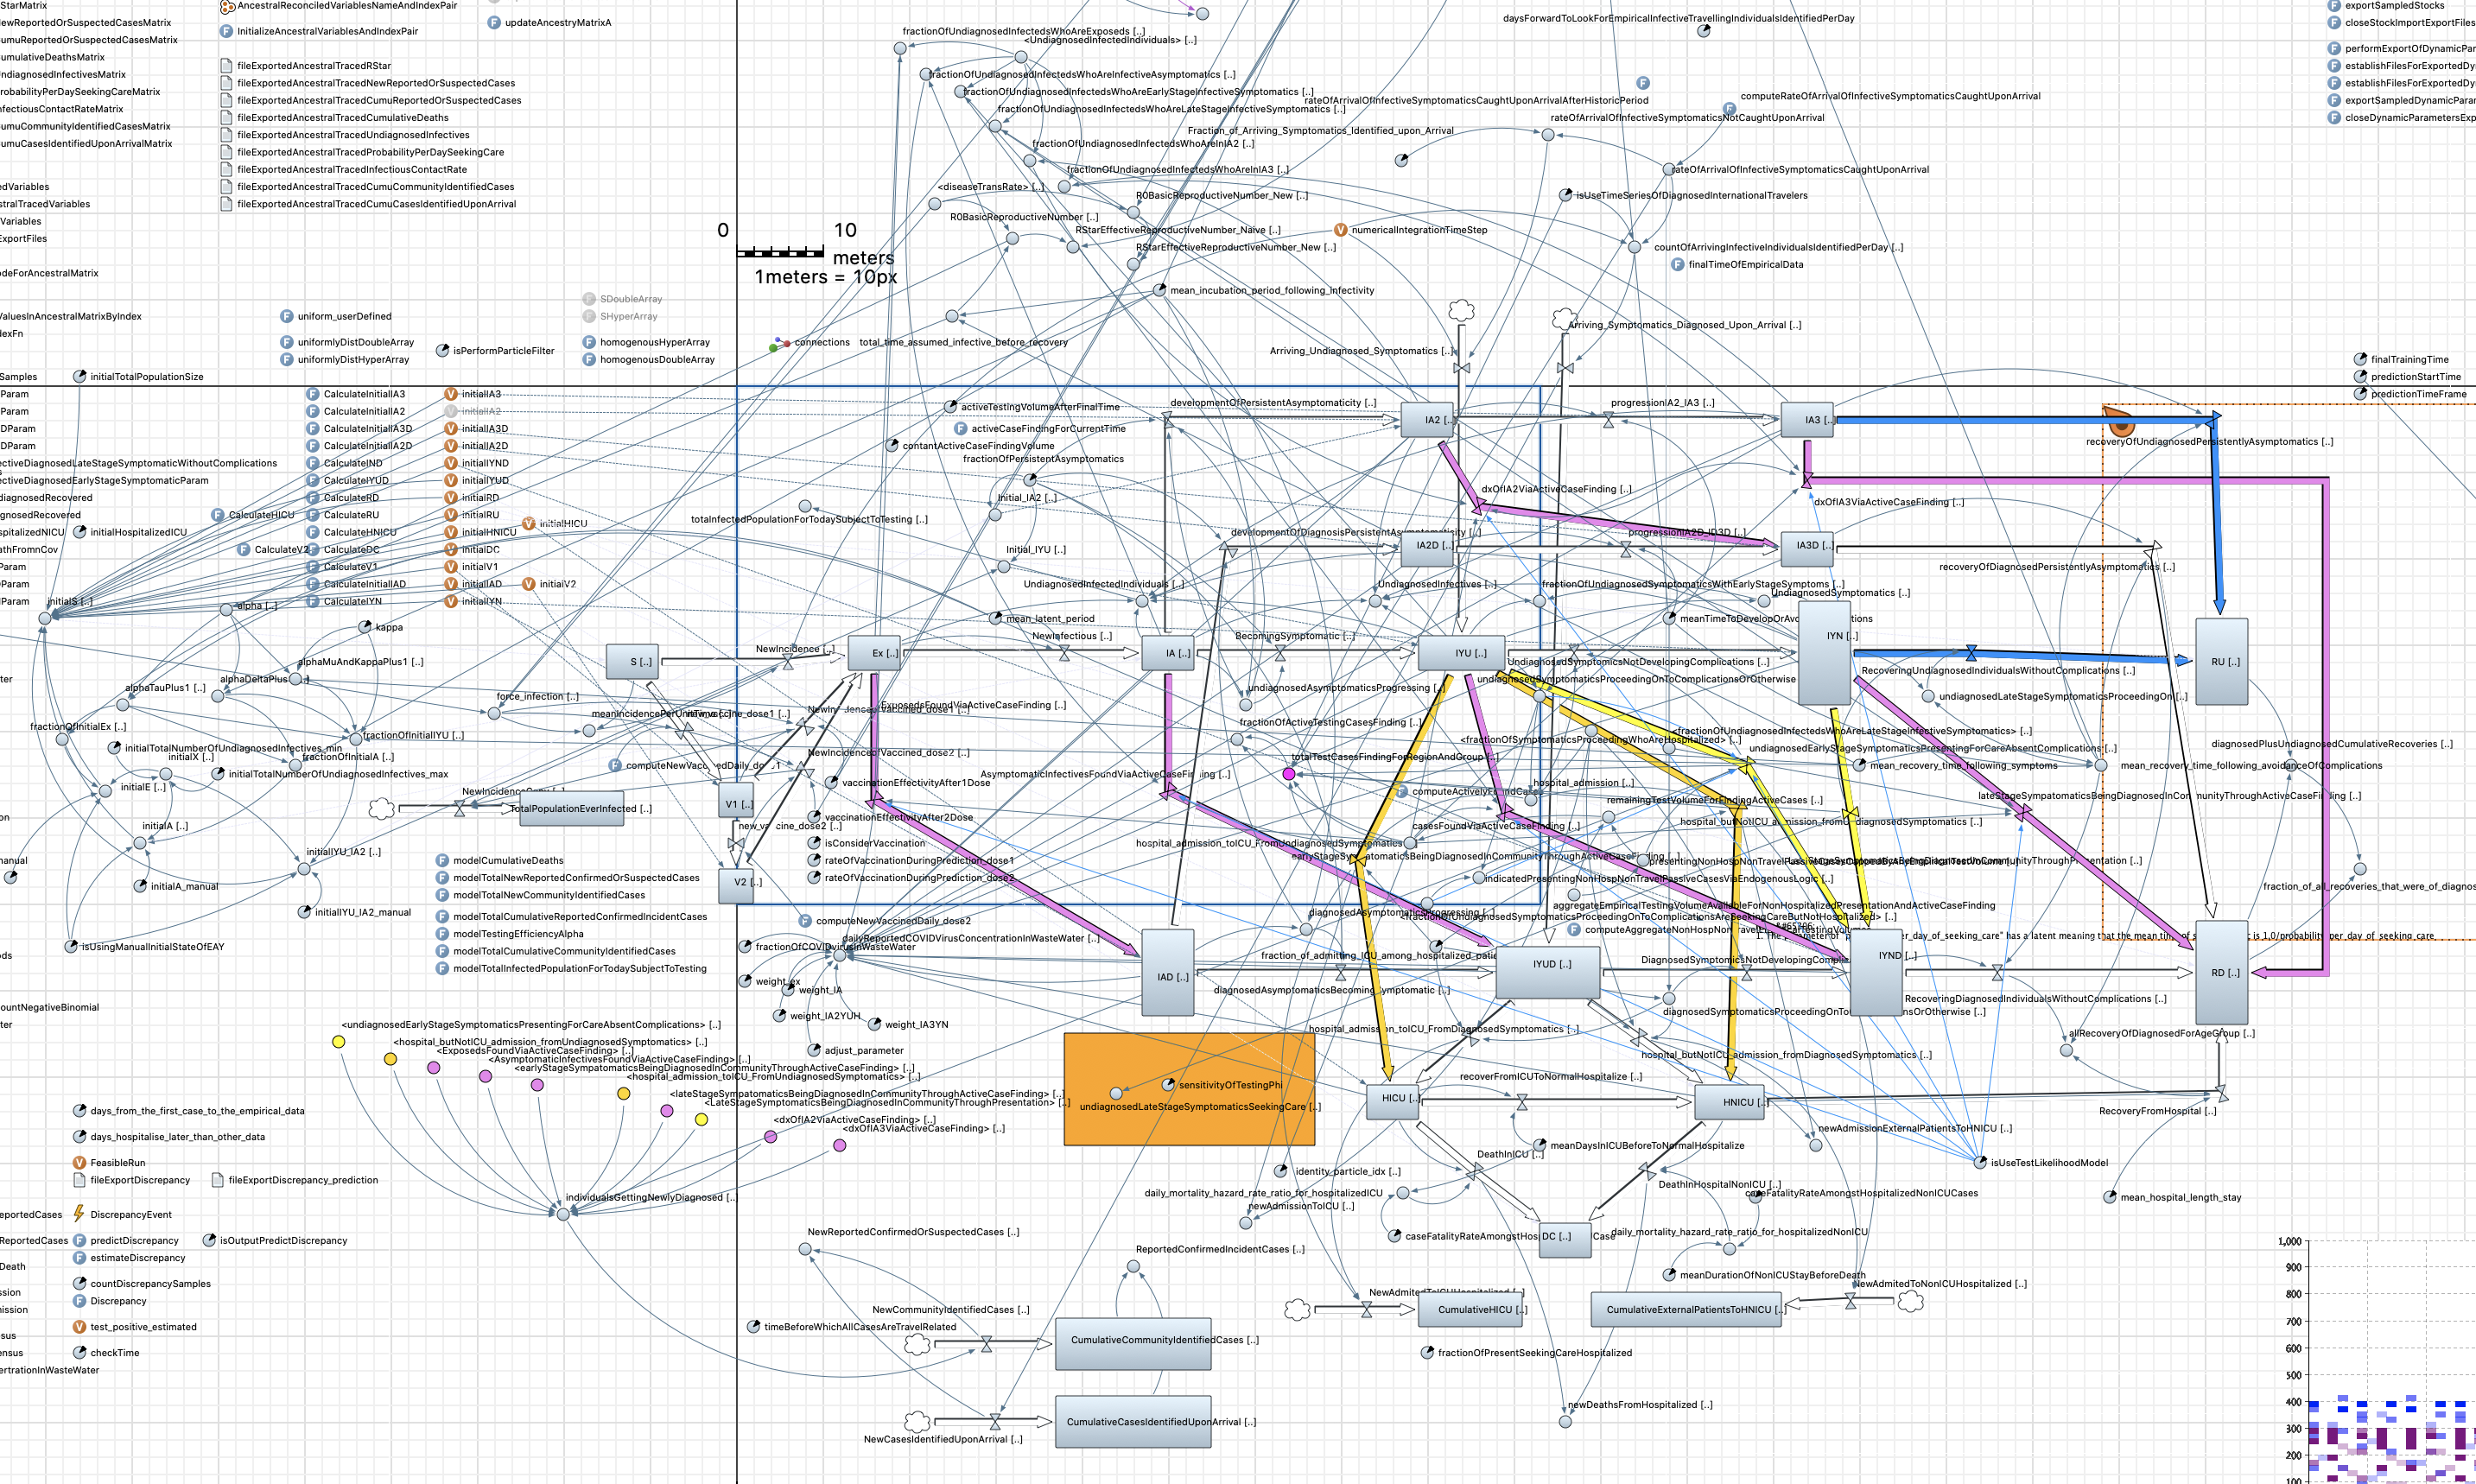
Click to enlarge. If it looks like a huge mess, that’s part of the point.
Working with a single huge model like this inhibits independent simultaneous work by multiple modelers. Lack of model modularity further prevents effective reuse of particular model elements. If elements of other models are used, they are commonly copy-and-pasted into the developing model, with the source and destination then evolving independently. Such separation can lead to a proliferation of conceptually overlapping models in which a single conceptual change requires corresponding updates in several successive models.
• The curse of dimensionality: Modelers refine simple models by ‘stratifying’ them, subdividing stocks into smaller stocks. For example, the ‘infected’ stock might be stratified into ‘infected male’ and ‘infected female’. While stratification is a key tool for representing heterogeneity, stratification commonly requires modifications across the breadth of a model—stocks, flows, derived quantities, and many parameters. When stratification involves multiple dimensions of heterogeneity, it can lead to a proliferation of terms in the ODEs. For example, rendering a model characterizing both COVID-19 into a model also characterizes influenza would require that each COVID-19 state to be replicated for each stage in the natural history of influenza. Represented visually, this stratification leads to a multi-dimensional lattice, commonly with progression proceeding along several dimensions of the lattice. Because of the unwieldy character of the diagram, the structure of the model is obscured. Adding, removing, or otherwise changing dimensions of heterogeneity routinely leads to pervasive changes across the model.
• Privileging ODE semantics: The structure of causal loop diagrams, system structure diagrams and stock-flow diagrams characterizes general state and accumulations, transitions and posited causal relations—including induced feedbacks—amongst variables. Nothing about such a characterization restricts its meaning to ordinary differential equations; indeed, many other interpretations and uses of these diagrams are possible. However, existing software privileges an ODE interpretation for stock-flow diagrams, while sometimes allowing for secondary analyses in ad hoc way—for example, identifying causal loops associated with the model, or verifying dimensional homogeneity in dimensionally annotated models. Conducting other sorts of analyses—such as computation of eigenvalue elasticities or loop gains, analysis as a stochastic transition system, or other methods such as particle filtering, particle Markov chain Monte Carlo, or Kalman filtering—typically requires bespoke software for reading, representing and analyzing stock-flow models.
• Divergence of model representations: Although the evolution from causal loop diagrams to system structure diagrams to stock-flow models is one of successive elaboration and informational enrichment, existing representations treat these as entirely separate characterizations and fail to capture the logical relationships between them. Such fragmentation commonly induces inconsistent evolution. Indeed, in many projects, the evolution of stock-flow diagrams renders the earlier, more abstract formulations obsolete, and the focus henceforth rests on the stock-flow diagrams.
What is less widely appreciated is that beyond their visual transparency and capacity to be lent a clear ODE semantics, the 3 kinds of diagrams I mentioned each have a precise mathematical structure—a corresponding grammar, as it were. This algebraic structure, called the ‘syntax’ of tehse diagrams, can be characterized using category theory. Formalizing the syntax this way lends precise meaning to the process of ‘composing’ models (building them out of smaller parts), stratifying them, and other operations. Explicitly characterizing the syntax in software also allows for diagrams to be represented, manipulated, composed, transformed, and flexibly analyzed in software that implements the underlying mathematics.
Formalizing the mathematics of diagram-based models using category theory and capturing it in software offers many benefits. Our paper discusses and demonstrates just a few:
• Separation of syntax and semantics. Category theory gives tools to separate the formal structure, or ‘syntax’, of diagram-based models from the uses to which they are put, or ‘semantics’. The syntax lives in one category, which can then be mapped to various different semantic categories using various functors. This separation permits great flexibility in applying different semantics to the same model. With appropriate software design, this decoupling can allow the same software to support a diverse array of analyses, which can be supplemented over time.
• Reuse of structure. Category theory provides a structured way to build complex diagrams by composing small reusable pieces. Diagrams are morphisms in a monoidal category, and you build bigger diagrams by composing and tensoring these morphisms. With software support, modeling frameworks can allow for saving models and retrieving them for reuse as parts of many different models. For example, in public health a diagram representing contact tracing can be reused across diagrams addressing different pathogens.
• Modular stratification. A categorical foundation further supports a structured method to build stratified diagrams out of modular, reusable, largely orthogonal pieces. This method is called taking a ‘pullback’. In contrast to the global changes commonly required to a diagram and the curse of dimensionality that traditionally arises when stratifying a diagram, categorically-founded stratification methods allow for crisply characterizing a stratified diagram as built from simpler diagrams, one for each heterogeneity or progression dimension.
Our paper goes into detail about how all this works. Elsewhere we have longer lists of what’s bad about current modeling practice, and how we hope to improve it. But I hope this helps a bit.